It’s barely 48 hours since the AEMO published their 2020 Electricity Statement of Opportunities (ESOO). As guest author Allan O’Neil noted in yesterday’s review of the highlights of the 2020 ESOO, the AEMO devoted the longest single chapter to a discussion about minimum demand, and what to do about it.
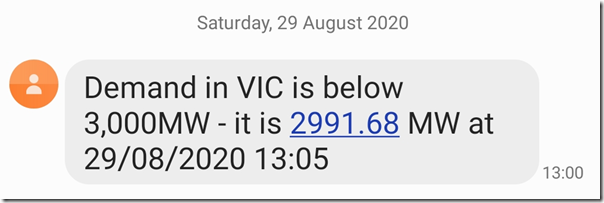
Uncanny, then, that I should pick up this SMS alert from our ez2view software today to notify me that the Victorian Scheduled Demand* had fallen to a low point way down at 2,992MW for the 13:05 dispatch interval today (Sat 29th Aug 2020):
* For those who forget the many different ways in which electricity demand is measured, here’s the detailed explanation.
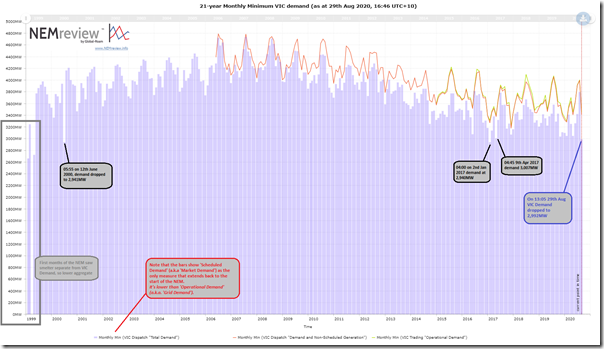
Curious as to what this level meant, in relation to the historical range of monthly minimums I updated this pre-prepared query in NEMreview v7 to see the trend:
As highlighted on the image, there were a couple other months where the monthly minimum was lower:
1) In the first few months of NEM operation, AEMO separately published demand at at least one of the aluminium smelters separately (probably both Portland and Point Henry, but don’t hold me to that). Hence the ‘VIC Demand’ figure for those early months should be discounted. There’s also some missing data in one of those months.
2) On 12th June 2000 the demand dropped down as low as 2,941MW … but this was at 05:55.
3) On 2nd January 2017 the demand dropped down as low as 2,940MW … but this was at 04:00 and after New Year’s Day….
PS1 on Mon 31st Aug 2020:
One astute WattClarity reader with a great memory has reminded me that this minimum demand would have reflected the absence of the Portland smelter, which was being rebuilt. The absence back in 2017 makes the low point last Saturday even more remarkable.
.
PS2 on Mon 31st Aug 2020:
Also worth linking to the comment on LinkedIn here by the Australian Aluminium Council about how the Portland smelter was using more than 15% of Victoria’s electricity consumption at a single site over the weekend just past. Bit of a contrast to January 2017.
.
4) On 9th April 2017 the demand dropped down as low as 3,007MW … so a little higher than today, and also at 04:45.
… so it may be that I have missed some ‘middle of the day’ low points in this quick scan, but it seems fairly likely that the low-point reached today was the lowest ever* for Scheduled Demand in VIC in the middle of the day.
* Obviously, in terms of ‘lowest ever’ we could wind the clock back 100 years or so to when Victorian electricity demand was next-to-nothing (can’t remember when Melbourne was electrified, but it was written up in Matthew Warren’s book). So when I mean ‘ever’, I mean in NEM times!
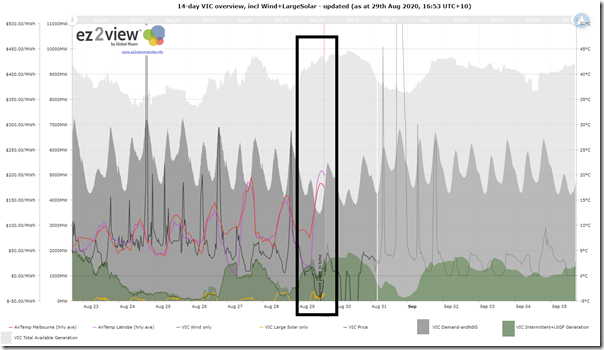
Snapshotting this pre-prepared, live updating 14-day overview of the VIC Region prepared using ez2view online, we can see some of the broader outcomes that occurred in the market:
In no particular order:
1) We see temperatures in Melbourne and Latrobe Valley being much more pleasant today than they have been through much of the week.
2) With VIC still in stage 4 lockdown as a result of COVID-19, it seems pretty certain that this would have led to reduced domestic electricity usage for heating as people enjoyed the better weather (made doubly nice by the news that today’s case numbers had dropped below 100 for the first time in this second wave).
3) We see the low level of demand was greatly eclipsed by the level of available generation capacity through the day (above 9,000MW). In particular we see a solid block of production from VIC wind farms through the day at the bottom of the chart.
4) The market crunch was exacerbated by some reductions on the export limits into NSW.
5) As a result of all of this, the price in VIC dropped below $0/MWh at around 10:00 and remained that way until around 17:00.
6) The large drop in aggregate output for both Wind and Large Solar coincident with the price crunch suggests that a number of wind and solar farms switched off due to the negative prices:
(a) hopefully they were not using Paradigm 2, which was a focus in the AER Issues Paper,
(b) but rather through their bids and dispatch instructions.
Only 2 days since the publication of the 2020 ESOO, welcome to the future already!


Scheduled demand in SA was also well down, 420MW in the 13:55 interval, which I believe is a new minimum demand (since 1999, excluding 2016 system black). Could be interesting times ahead in the next month or so as rooftop solar generation starts ramping up even further, but before the normal summer higher demand from daytime air conditioning starts taking effect.
Did not look specifically at SA demand, John, but it does appear to have been close to a ‘new record low’ for NEM-wide scheduled demand, as noted here:
https://wattclarity.com.au/articles/2020/08/casestudy-29th-august-2020/
PS, John
Excluding the System Black, the low point in Scheduled Demand (i.e. TOTAL DEMAND) was 360MW at 13:40 on 9th March 2020 as noted here:
https://wattclarity.com.au/articles/2020/03/scheduleddemand-sa-lowestever-exclsystemblack/