On Tuesday 5th May, I posted the lengthy article ‘Balancing Supply and Demand …. in the fast approaching ‘NEM 2.0’ world’. I invested the time to do that because we see some important questions in there that need to be answered in order to make a ‘NEM 2.0’ market actually delivers* on what it needs to deliver for the energy transition to succeed.
* Another week has passed, and we’re now less than a week from when submissions were requested on the COAG Energy Council’s discussion paper on ‘Moving to a two-sided market’ (due Monday 18th May). It seems essential that the concerns raised in this analysis should be central to ascertaining how a viable supply/demand process can operate as this energy transition gathers pace.
There were other reasons as well, not least of which was because thinking through changes and challenges like these stands us in much better stead to be ready to continue serving our growing client base well beyond the 2025 start date for NEM 2.0.
(A) Context…
This article is the third (in a group of four Case Studies) that follows on from those thoughts.
These 4 are intended to look at each extreme of a 2 x 2 Matrix defined in the longer* article. That article explored aggregated ‘Raw Off-Target’ for both ‘all Coal’ units and also ‘all Wind’ units operational through 2019 – using data compiled for the Generator Statistical Digest 2019.
* I’m aware that this article has grown quite lengthy. If I had more time, I would be trying to make it shorter.
(A1) … about aggregate Raw Off-Target
In highlighting the ‘worst’ four dispatch intervals through all 105,120 in 2019 for both the ‘all Coal’ and ‘all Wind’ groupings in the 5th May article, I published a summary table – which is copied in here:
| . | Aggregating All SS Wind 39 units | Aggregating All Coal 48 units |
| Under-Performance (including trips) Aggregate Raw Off-Target >> 0MW |
The worst dispatch interval for wind was 02:25 on Sunday 1st September 2019. On this occasion, the ‘all wind’ group saw an aggregate Raw Off-Target was +375MW. Several other things that could be noted: This is the subject of this particular Case Study. |
The worst dispatch interval for coal was 08:05 on 9th October 2019. On this instance, the ‘all coal’ group saw an aggregate Raw Off-Target as high as +709MW: This was discussed yesterday in this Case Study here. |
| Over-Performance Raw Off-Target << 0MW |
The worst dispatch interval for wind (-301MW) was 19:25 on 31st October 2019. In this instance: This will be discussed in a Case Study here. |
The worst dispatch interval for coal was 15:05 on 12th October 2019. This was just 3 days after the worst outcome at the opposite extreme! This was discussed in this Case Study here on 6th May. |
This article today is the third of four case studies.
(A2) … about why we invest time in these Case Studies
Also worth reiterating some of the reasons why we significant invest time in delving into specific instances through case studies like these (some of which make their way onto WattClarity).
Do you know of others who can help us expand our capability?
(B) A focused look at this Dispatch Interval
In this particular Case Study, we focus on the ‘worst’ example of an aggregate Raw Off-Target for ‘all wind’ units well above 0MW (i.e. where these units were, collectively, under-performing) – specifically this occurred at 02:25 on Sunday 1st September 2019.
(B1) All Wind Units
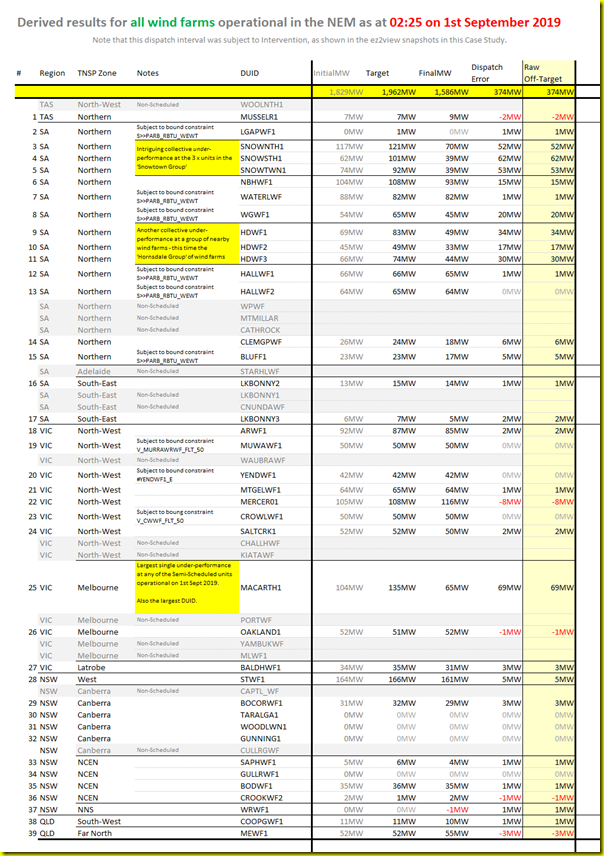
In the table below I have compiled the relevant data for all of the 39 x wind units at that dispatch interval (i.e. only the Semi-Scheduled units, as the performance of the Non-Scheduled units cannot be ascertained on this basis):
Click on the image for a larger view.
The table shows the aggregate Raw Off-Target adding up to be +374MW (rather than the more precise +375MW noted at the top), because of rounding.
These results are further discussed below.….
(B2) Most wind farms under-performing …
The first thing that jumps out to me in reviewing the results in the above table is that, of the 39 x wind units listed in the table, a clear majority of wind farms were under-performing (i.e. a total of 26/39 wind farms, or 67%, had a Raw Off-Target > 0MW). In contrast, there were only 5 wind farms over-performing and 8 wind farms with a Raw Off-Target at 0MW with rounding.
Observation #1) Whilst this Case Study only deals with a sample set of a single dispatch interval (i.e. far from statistically significant!), it does reinforce questions about the types of more prevalent ‘failure modes’ that need to be explicitly considered, and planned for, in the electricity grid/market that will be in place as the energy transition rolls into ‘NEM 2.0’:
(1a) In the ‘old world’, which is phasing out, it was not impossible to experience simultaneous failure, or under-performance, across a group of coal units.
i. Situations have existed (e.g. wet coal affecting multiple units onsite, Morwell river breaking its banks, and the occasional lightning strike).
ii. However these sorts of events were quite rare, given the nature of the technology.
(1b) In the ‘new world’ we’re progressing into my sense is that there are certain types of ‘multiple simultaneous contingency’ risks which will need to be explicitly planned for, and prepared for.
i. The simultaneous tripping of multiple wind farms on the day of the SA System Black in September 2016 was one (perhaps infamous) example of where common reliance on some technical equipment across discrete sites delivered a risk that was only identified after an extensive autopsy after the fact (and is the subject of ongoing court proceedings).
ii. What we observe on 1st September was nowhere near as calamitous as that event, but also suggests reliance on common elements across multiple sites (in this case, perhaps weather-related elements as explored below).
(B3) … some Wind Farm significantly under-performing
Of the 26 x wind farms that were under-performing in the group above, there were some that had a much greater impact than others.
In this case study we will look at some of these. Thankfully, it is quite easy (using the ‘Time-Travel’ function in our ez2view software) to wind back the clock and review what the start of the market was at that time – using the ‘Unit Dashboard’ widget shown here:
(B3a) Macarthur Wind Farm
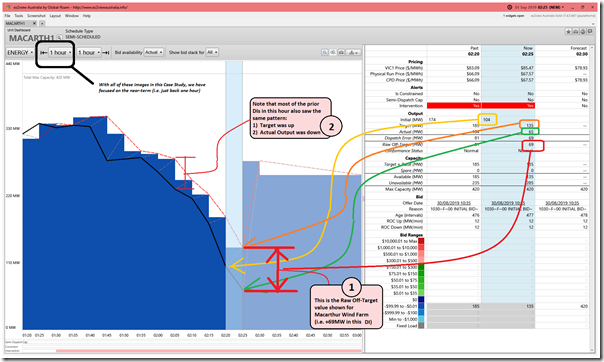
With a 69MW under-performance on a Dispatch Target of 135MW we can see that Macarthur Wind Farm made the largest contribution to the aggregate Raw Off-Target measure (i.e. 18% in total).
What follows is a snapshot of the ‘Unit Dashboard’ widget in ez2view focused on this particular dispatch interval (02:25 on Sunday morning, 1st September 2019):
Observation #2) It’s very obvious in this snapshot that the expectation for unit output was not only significantly incorrect, it also went in the wrong direction:
(2a) The unit had been expected to increase its output (by +31MW), but instead it went the other way (by –39MW). Combining the two together reveals the Raw Off-Target performance of 69MW, with rounding.
(2b) Furthermore, we see that this had been the pattern over much of the prior hour – on each occasion the forecast was for an increased output, but the actual output continued to sink lower and lower.
(2c) On and individual unit basis, we see that the performance of Macarthur was worse in the prior dispatch interval (i.e. a Raw Off-Target of +81MW).
Observation #3) As before we need to be clear that we are not attributing ‘blame’ to those associated with Macarthur for operating in this way.
(3a) Unfortunately, as noted on 28th January 2020 with results from the GSD2019, Macarthur Wind Farm seems to deliver a disproportionate share of these extreme outcomes.
(3b) We wonder if there are not particular aspects of Macarthur’s design that contribute to its ‘worst performer’ results.
i. This could be the subject of a different analysis.
ii. For now, we are more interested in the collectively ‘bad’ performance across a number of different wind farm.
Observation #4) Notwithstanding the fact that we have not yet ascertained exactly the reason for these results for Macarthur, it must be noted that the results are not really a surprise, given the structure of incentives currently in place with the way the Semi-Scheduled category works.
(4a) It’s been noted to me that the current approach* was adopted, in part, due to an assumption that the ‘unders and overs’ would even themselves out across a fleet of wind farms if there was enough diversity in their locations (and hence wind patterns).
* note that the way the Semi-Scheduled category works is explained in this growing Glossary page here. Key point is, from this perspective, that an alternative might have been to require all wind farms to be fully Scheduled. This probably would have meant that more wind ‘spilled’ as a result.
(4b) Part of the questioning we’re doing here is wondering whether this benefit (i.e. increased low-emissions electricity) outweighs the cost of the design as the share of wind production in the NEM grows.
i. A key input into answering this question seems to be resolving whether ‘diversity will solve it’, as others seem to assert.
ii. Seems a very important question to get to the bottom of, to ascertain the extent to which it is true – or just another ‘magic wand’?
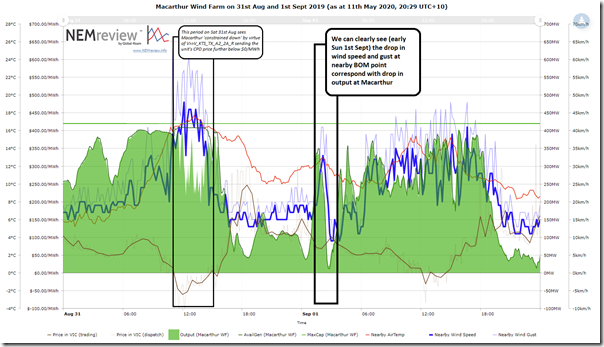
An obvious potential culprit for the big discrepancy above was some sudden (and unforecast) change in wind speed. Thankfully with NEMreview v7 it is easy to produce the following trend which highlights some of the key variables for Macarthur, along with the wind speed and temperature at the nearest BOM measurement location:
Those with their own access to the NEMreview software can also access a copy of this Query here. As noted in the GSD2019, the nearest BOM measurement location to Macarthur WF is ‘Warrnambool Airport NDB’.
Observation #5) It’s clear that there was a rapid drop in wind speed (33km/h to 9km/h) coinciding with a drop in output at the Macarthur Wind Farm:
(5a) This helps explain the drop in output of the wind farm (>300MW in 50 minutes).
(5b) What’s not possible to ascertain in the data we currently have access to is the extent to which this drop in wind speed was not forecast immediately beforehand – hence why it was apparently so much of a surprise in the dispatch targets.
(5c) Also worth noting that other possible reasons for rapid reductions in output (such as high wind speed cut-out, or high-temperature cut-out (itself a stressful feature of summer 2019-20)) don’t seem so likely in this case.
Driven by some questions we’ve bounced around internally in putting this article over the past couple days (much appreciated, Marcelle) I’ve also opened up the ‘Forecast Convergence’ widget in ez2view to have a look at what could be seen in terms of how AEMO’s forecasts changed specifically for Macarthur Wind Farm and can see a bit more in this respect.
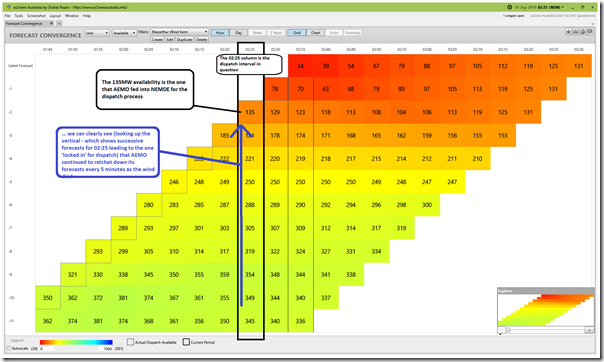
The first view shows a tabular view of successive P5 forecasts for Available Generation coming from AWEFS for all wind farms (i.e. except for those which submit self-forecasts closer to real time):
Observation #6) Looking up the vertical for 02:25 on the day and reviewing successive forecasts for Available Generation for Macarthur, we see that AEMO was rapidly revising its forecasts down as the wind died :
(6a) However we know (from the ‘Unit Dashboard’ view above) that the much reduced forecast for Available Generation for Macarthur Wind Farm of 135MW from AWEFS which made its way into NEMDE was still far too generous, with the actual output another 69MW lower still!
(6b) Does raise questions about ‘where’d the wind go?’ in such a short period of time.
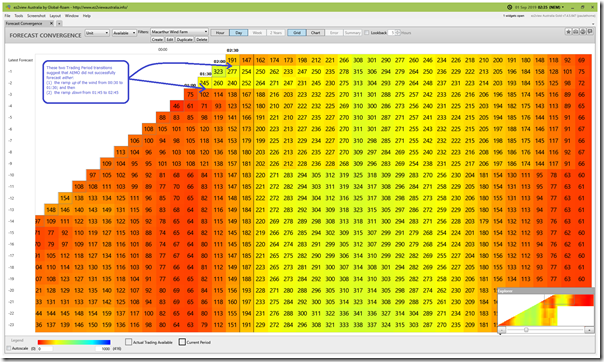
Spurred by these internal discussions, I wound the time-horizon out to ‘DAY’ (thereby looking at P30 forecast and ‘actual’ Trading data, rather than P5 forecasts and Dispatch Data):
This is where it grows even more interesting…
Observation #7) In this case, we see that the AEMO had trouble forecasting both sides of what appears to be a sudden and dramatic hour-long burst of wind – both the ramp up and the ramp down!
(B3b) The ‘Snowtown Group’ of Wind Farms
As a second point of focus I’d also note that the 3 discrete DUIDs that collectively represent what I’ve called the ‘Snowtown Group’ of wind farms in the mid-north of South Australia. In aggregate the Raw off-Target performance of these wind farms was +167MW in this dispatch interval (i.e. +167MW of the +374MW total equates to 45%).
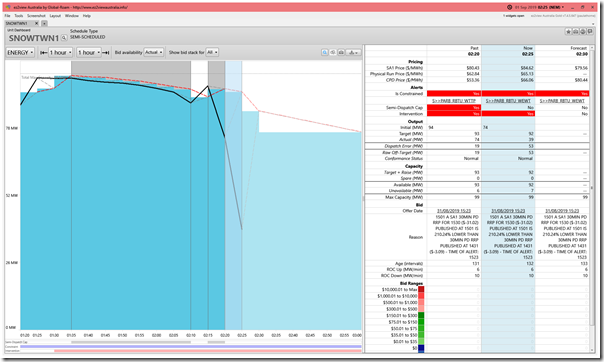
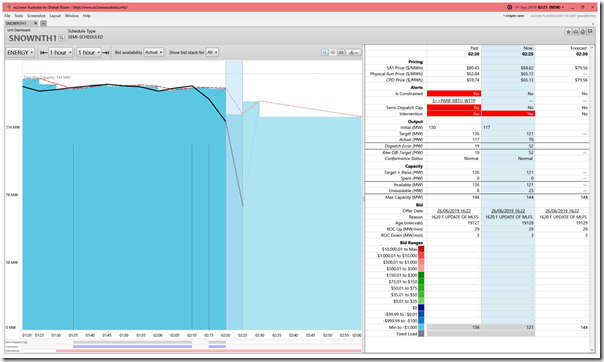
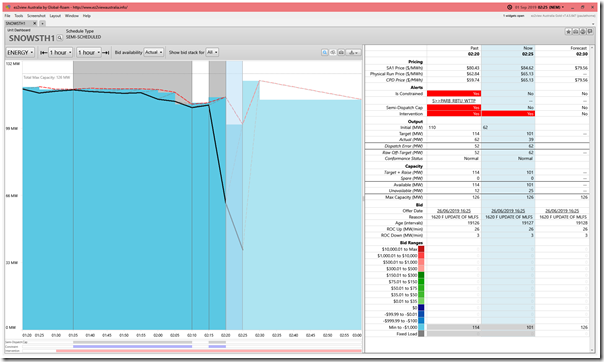
In order to help readers understand the pattern of what was happening, here’s a similar ‘Unit Dashboard’ views for the three different DUIDs from ez2view, Time-Travelled back to 02:25 on Sunday 1st September 2019:
A remarkably similar pattern in this dispatch interval, and the prior one, as what was seen at Macarthur Wind Farm:
Observation #8) As with Macarthur Wind Farm, these three Wind Farms (Snowtown 1, Snowtown 2 North and Snowtown 2 South) all saw a ‘going in the wrong direction’ pattern whereby the Dispatch Target shows AEMO’s expectation was for an increase in output, yet all three wind farms each significantly reduced output.
(8a) We see that the large percentage drop in output at Snowtown 2 South happened in the prior dispatch interval (i.e. 02:20) whereas the large percentage drop occurs for Snowtown 1 and Snowtown 2 North in the current dispatch interval (i.e. 02:25).
(8b) These wind farms are located close together so it is understandable that they would be affected by the same wind patterns.
Observation #9) We see that, unlike the other two, the Snowtown 1 Wind Farm was subject to bound constraint ‘S>>PARB_RBTU_WEWT’:
(9a) Because the unit had a negative factor on this constraint, it had a slight effect of raising the unit’s CPD Price compared with the (intervention-adjusted, physical run) dispatch price for the region.
(9b) Some might term this colloquially as being ‘constrained up’, but the reality is it made no difference, as the unit was bidding at –$1,000/MWh anyway.
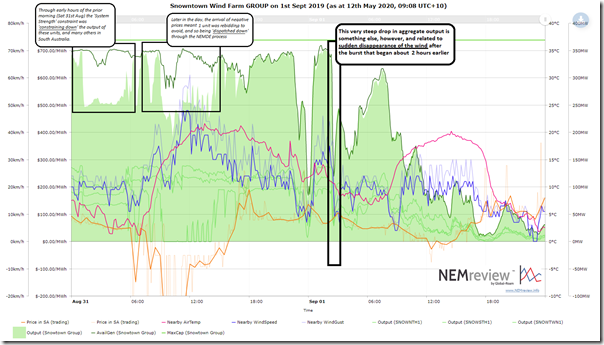
Using this trend query from NEMreview v7, we can see the trend in aggregate output for the three units in the ‘Snowtown Group’:
Observation #10) As was the case with Macarthur Wind Farm, we see that there was a very sharp reduction in wind speeds near the site coinciding with the sharp – and unexpected – drop in aggregate output across the three units
(10a) As noted above, we are unable to ascertain whether this sudden drop in wind speed was forecast ahead of time – though the unexpected nature of the drop in output seems to suggest it came as a surprise.
(10b) I wonder about the physical distance between the Snowtown Group of wind farms and the Macarthur Wind Farm, and what the implications are of such sudden – and sizeable – lulls in wind across two separate locations.
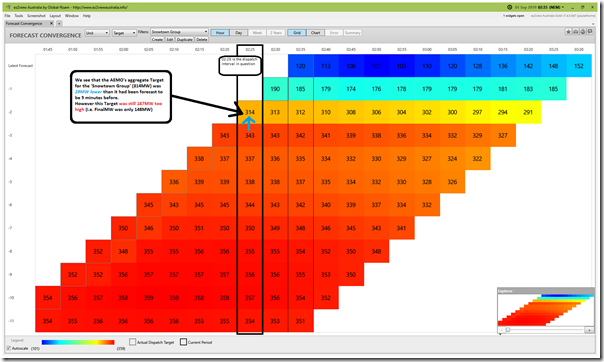
Intrigued by the revelations in using the ‘Forecast Convergence’ widget in ez2view for the Macarthur Wind Farm above, I’ve flipped to view Target (not Available Generation) and aggregated targets for each of the units in the ‘Snowtown Group’:
Observation #11) In contrast to Macarthur Wind Farm (where AEMO had been ratcheting down the forecasts – just not quickly enough) it appears from this data that the sudden drop across the three Snowtown units had been almost totally out of the blue.
(11a) AEMO had made a slight reduction in Target from that which had been previously forecast (i.e. reducing from 343MW to 314MW, a reduction of 29MW).
(11b) However this Target (314MW) was a massive amount (167MW) higher than what it should have been (i.e. FinalMW was collectively only 148MW across these three units).
(11c) On this occasion it does seem that the AWEFS process was blindsided by a sudden – and unexpected – lull in wind strength.
(B3c) The ‘Hornsdale Group’ of Wind Farms
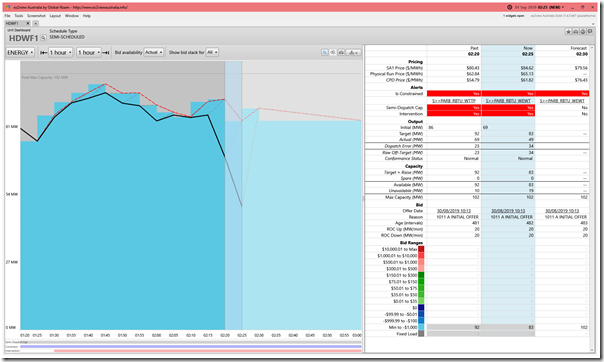
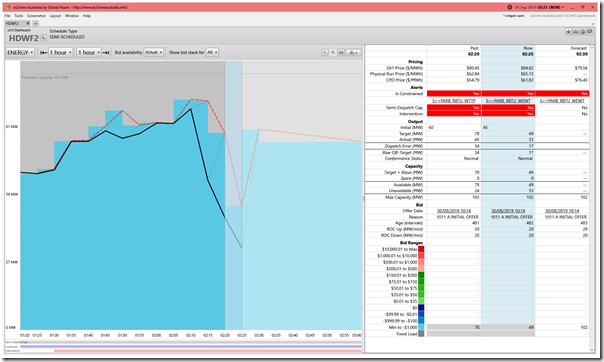
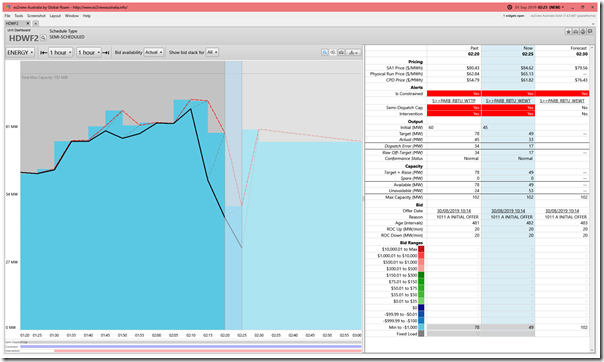
The second group of wind farms that collectively reduced output in an unexpected way was what I’ve called the ‘Hornsdale Group’ of wind farms, also in South Australia. In order to help readers understand the pattern of what was happening, here’s a similar ‘Unit Dashboard’ views for the three different DUIDs from ez2view, Time-Travelled back to 02:25 on Sunday 1st September 2019:
With respect to these three wind farms, here’s some additional observations:
Observation #12) In aggregate the Raw off-Target performance of these wind farms was +81MW in this dispatch interval (i.e. +81W of the +374MW total equates to 22%, so a higher percentage influence than Macarthur Wind Farm for a smaller aggregate Maximum Capacity).
Observation #13) As with the Snowtown 1 Wind Farm, we see these three units are all affected by the bound constraint ‘S>>PARB_RBTU_WEWT’:
(13a) In this case, they all have a positive factor, would be termed colloquially as being ‘constrained down’
(13b) The CPD Price is shifted slightly downward, compared to the (intervention-affected physical run) dispatch price for the region;
(13c) But again this makes no difference on the output, as the unit is bidding at –$1,000/MWh (i.e. well below the CPD price, with other units on this constraint equation wearing the pain of being ‘constrained down’).
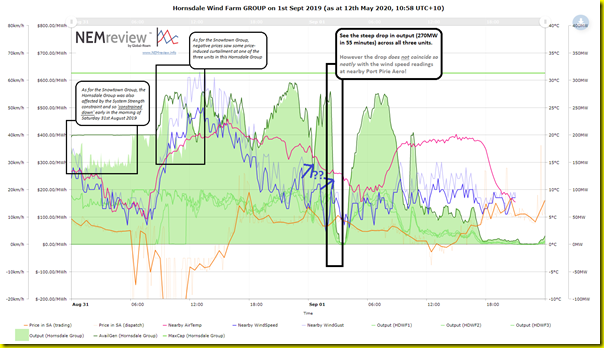
Using this trend query from NEMreview v7, we can see the trend in aggregate output for the three units in the ‘Hornsdale Group’:
Observation #14) Unlike where it can be clearly seen in the chart for the Snowtown Group above, there is not as clear a correlation between
(14a) Perhaps this is because the nearest ‘nearby’ location we can map to for BOM Wind Speed data is Port Pirie Aerodrome in this case?
(14b) If any of our readers can help me better understand what went on with the three wind farms in the Hornsdale group at the time of this large and steep drop in output, I would very much like to know please?
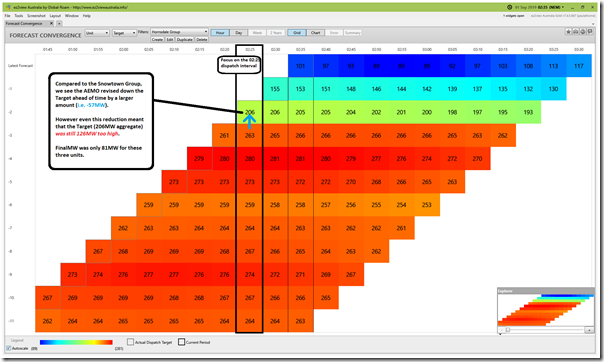
Again using the ‘Forecast Convergence’ widget in ez2view for the ‘Hornsdale Group’ of 3 units and keeping the focus on Target we see the following:
Observation #15) Perhaps AEMO had a little more anticipation that output at the ‘Hornsdale Group’ was going to drop significantly – however the Target was still significantly too high:
(15a) AEMO had made a slight reduction in Target from that which had been previously forecast (i.e. reducing from 343MW to 314MW, a reduction of 29MW).
(15b) However this Target (314MW) was a massive amount (167MW) higher than what it should have been (i.e. FinalMW was collectively only 148MW across these three units).
(15c) On this occasion it does seem that the AWEFS process was blindsided by a sudden – and unexpected – lull in wind strength.
(B3d) Hallett 4 (North Brown Hill) Wind Farm
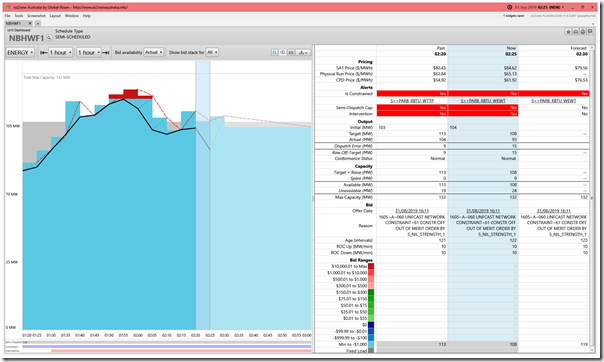
Of the 39 x Semi-Scheduled Wind Farms in the listing above, 9 x Wind Farms experienced double-digit positive ‘Raw Off-Target’ discrepancies – including those 7 in the list. Also located in the mid north of South Australia, the North Brown Hill Wind Farm (originally branded as ‘Hallett 4’, and so presented as this in the GSD2019, we include the same focused view of the 02:25 dispatch interval in the Time-Travelled ‘Unit Dashboard’ widget from ez2view, focused on the NBHWF1 unit:
Observation #16) Here for this unit we can see the same general pattern, with the dispatch target suggesting an increase in output, but the actual output trending the other way:
(16a) We can also see that this has been happening for the past few dispatch intervals.
(16b) In proportional terms, the Raw off-Target was +15MW in this dispatch interval (i.e. +15MW of the +374MW total equates to 4%).
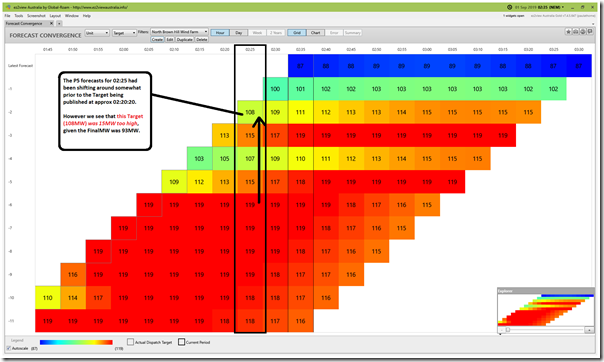
Flipping the ‘Forecast Convergence’ widget in ez2view to look at just the Targets, and prior P5 forecast Targets for NBWF1, we see a slightly different picture:
Observation #17) The shifting of the forecasts for 02:25, in parallel with the shifting of Targets set for dispatch intervals from 02:10, suggests that the AEMO had some indication that the wind patterns were changing. However the lower Target set for 02:25 was still 15MW too high.
(B3e) Willogoleche Wind Farm
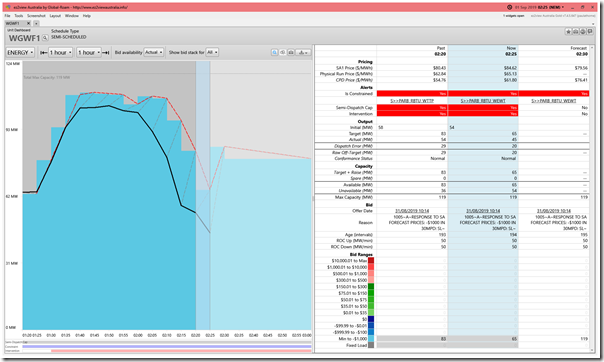
Also in the mid-North area, and the last of the 9 x ‘double digit discrepancies’, here is the same focused view of the 02:25 dispatch interval in the Time-Travelled ‘Unit Dashboard’ widget from ez2view, focused on the WGWF1 unit:
Observation #18) Here for this unit we can see the same general pattern, with the dispatch target suggesting an increase in output, but the actual output trending the other way:
(18a) We can also see that this has been happening for the past few dispatch intervals.
(18b) In proportional terms, the Raw off-Target was +20MW in this dispatch interval (i.e. +15MW of the +374MW total equates to 5%).
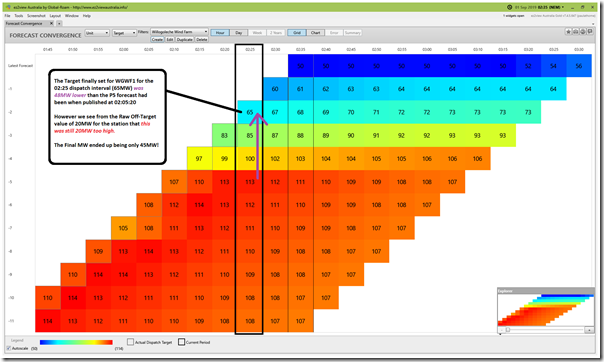
Flipping the ‘Forecast Convergence’ widget in ez2view to look at just the Targets, and prior P5 forecast Targets for WGWF1, we see a slightly different picture:
Observation #19) In the 15 minutes prior to the publication of the Target for 02:25, the forecast had dropped by a large amount (i.e. 48MW) compared to the Target issued at the time (65MW). However even that proved 20MW too high, with the drop in wind harvest outpacing even the aggressive decline in wind capability forecast by AEMO in AWEFS.
(C) Other quick thoughts
Two other quick thoughts today, whilst they occur to me.
(C1) Geographical spread
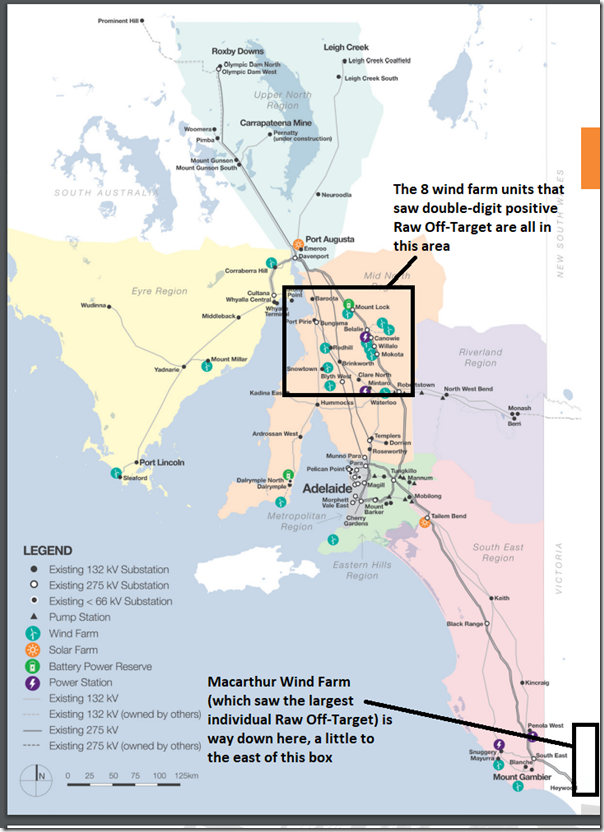
Borrowing Figure 4.2 from ElectraNet’s ‘Annual Planning Report’ for 2019 it’s easy to see that there is a fair distance between Macarthur WF and the collection of 8 other offending wind farm units in the mid-north of South Australia:
Observation #20) It seems plausible that it was the same weather pattern in the mid-north of South Australia that yielded the sudden drop off in performance of the 8 x SA-based wind farms.
Observation #21) However the distance, and the fact that others in between did not display the same thing (e.g. Lake Bonney) suggest that the drop in wind output at Macarthur was just a coincidence:
(21a) Bears re-iterating that this coincidence was an unfortunate one, in helping to deliver the record of ‘worst Dispatch Interval’ for the ‘all Wind’ collective group.
(21b) These different types of ‘multiple contingency’ events will need to be increasingly factored into planning moving forwards.
(C2) A focus just on South Australia
Given that 8 of the 9 ‘double digit’ wind farms were in South Australia, it’s worth having a particular look just at South Australia, to see what the situation was at the time:
Observation #22) Leaving out the contribution to ‘Raw Off-Target’ of Macarthur Wind Farm and others not in the South Australian region, we can still see that the aggregate deviation for just SA wind farms equated to 300MW.
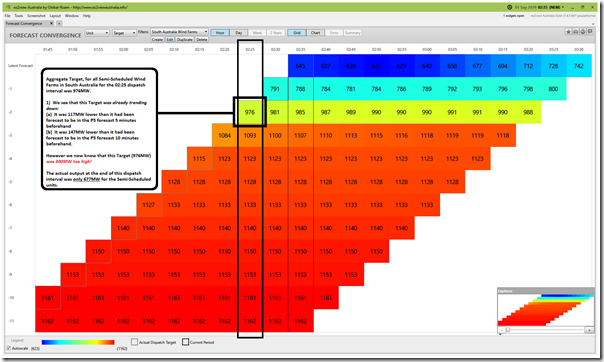
Utilising the ‘Forecast Convergence’ widget in ez2view again and expanding the focus to show Aggregate Target for all the Semi-Scheduled wind farms in South Australia:
Observation #23) This helps clarify that the AEMO had been ratcheting down its collective forecasts for output of the South Australian Semi-Scheduled wind farms:
(23a) At the point of dispatch, the collective Target was 976MW;
(23b) This was already lower than had been forecast just five minutes before it by 117MW (i.e. a 11% reduction to its ‘final’ Target)
(23c) We now know, however, that this already reduced Target was still too high by the tune of 300MW!
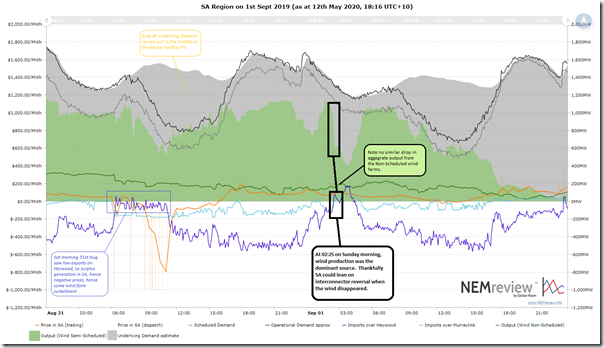
Finally, it’s also worth noting that this occurs at 02:25 in the morning, a time where traditionally demand would have been close to a daily minimum (it’s a little more complex now with the operational of rooftop PV changing the timing of low-points in ‘grid demand’). Using this trend query from NEMreview v7, we can see the trend in major :
Observation #24) With underlying demand in the South Australian region being approximately 1,300MW at 02:25 we can clearly see that a 300MW aggregate Raw Off-Target for ‘all Wind in SA’ would make a sizeable dent in the supply/demand balance:
(24a) Thankfully South Australia was able to draw back on its exports to Victoria at the time, and even tip over to importing via Heywood and Murraylink for a period.
(24b) With recent media coverage about the SA Government’s push to accelerate the transition to 100% net renewable energy for the state, it’s important to keep in mind the criticality of the interconnectors for occasions like these (and be thankful that this islanding did not happen at the same time!)
(24c) Astute readers will note that the decline in aggregate Semi-Scheduled Wind output shown here (steepest being perhaps 375MW over 15 minutes straddling 02:25) understates the significance of the deviation, as:
i. Not only did the actual output decline significantly over the period;
ii. We need to remember that the targets (as show above) stubbornly kept insisting output would increase – despite them continuing to go the other way;
iii. This meant a yawning gap between expectation and actual that was 300MW large just in the 02:25 dispatch interval.
(C3) Broader questions…
Summing up some broader questions, I only have time remaining to note the following.
(C3a) Systemic ‘failure’ modes?
Touching on Observation #1 above, the analysis above suggests that what happened in this dispatch interval might have been the result of:
Factor 1 = some underlying weather pattern that affected 8 wind farm units all located in the mid-North of South Australia (though strangely not some others); coincident with
Factor 2 = some other weather pattern, which may not be related to the 1st, which also affected Macarthur Wind Farm suddenly and unexpectedly.
Question #25) What needs to be done to prepare for a ‘NEM 2.0’ world in which it seems much more likely than in the past that we will experience systemic challenges like this that will affect the operations of multiple units that have some geographical separation?
(C3b) Risks to reserves and security of supply?
In Observations #23 and #24 I explored briefly what some of the numbers were just with respect to South Australia:
Question #26) Would be worth some input from those more directly involved than me on the key differences between this event and other events which have been more critical for supply/demand balance:
(26a) One example to compare would be 8th February 2017 – where unforecast shortage of wind was one of the factors ultimately contributing to Actual LOR3 conditions and Load Shedding in South Australia:
i. This event was posted about here on the day and then the following day; and then
ii. AEMO published this ‘System Event Report’ on 15th February.
(26a) Also noted above was the more recently islanding of South Australia that began on 31st January 2020:
i. This was discussed in this series of articles.
ii. Had interconnector flexibility been limited at the same time, the outcomes might have been quite different on 1st September 2019 in response to the disappearance of 300MW of wind (but then the operating procedural changes since the SA System Black, particularly the Interventions routinely operated in South Australia for System Strength reasons, would have meant wind would probably have been curtailed prior to reaching such a high percentage level if that had been the case).
(C3c) Better forecasts?
At the root of the poor performance seen in this dispatch interval was the Australian Wind Energy Forecasting System (AWEFS), which seemed to have a bad morning – at least with respect to these particular DUIDs:
Observation #27) The actual performance (i.e. FinalMW) against forecast (i.e. Target) is illustrated in the ‘Unit Dashboard’ snapshots for each of the 9 DUIDs that are the focus of this article:
(27a) In many of these cases (and for more than just the 02:25 dispatch interval) we see the strange situation repeat whereby the trend of actual output over successive dispatch intervals is down, yet the Target suggests that AWEFS thought the output would continue increasing (like it was stuck in a loop it could not learn its way out of).
(27b) I wonder to what extent self-forecasts (which participants can now submit to AEMO to use instead of AWEFS forecasts) .
i. We’re aware that an increasing number of DUIDs are trialling this approach.
ii. The relative performance (self-forecast against AWEFS/ASEFS) might be something we could explore in the next update to our Generator Report Card?
Question #28) As discussed on 5th May, I have real questions about whether the way in which the Semi-Scheduled category operates is both scalable and sustainable – and hence fit for purpose in ‘NEM 2.0’:
(28a) This particular dispatch interval highlights one of the challenges relating to performance of individual units (and readers will note from these results that there are plenty more extreme outcomes, for many wind farms).
(28b) Whilst technology improvements (e.g. self-forecasts) might offer some promise for improving the situation for the future, I am concerned that we’re collectively trying to do this with one hand tied behind our backs – i.e. without the incentives being fully placed on the right parties.
(28c) That’s why it was of interest to see some thoughts expressed about ensuring incentives are with the appropriate organisations in helping to balance supply and demand in the dispatch process:
i. These thoughts were expressed (albeit vaguely) in the COAG Energy Council’s discussion paper about ‘Moving to a two-sided market’.
ii. Remember submissions due next Monday 18th May on that one.
————
That’s all I have time for today.
One more of this group of 4 x Case Studies will follow as time permits. Last one is about the ‘worst’ example of ‘all Wind’ collectively over-performing….


Interesting.
My thoughts, coming from having operated several windfarms, is that you can have quite fast and dramatic wind changes associated with fronts moving through. With a front, you often get a change in wind direction as well, and I wonder if the time for the WTG to react to the changed wind direction is affecting this. The WTG take some time to react and yaw to a new heading, with some time delay to ensure the WTG aren’t constantly yawing for each minor gust. With the WTG out of alignment to the wind direction, this also has a significant negative energy output, not allowed for in the forecasts.
You do also see the alignment of fronts across multiple sites, which might account for the same affect across the many sites, including MacArthur. It is was a large front, Lake Bonney would have reduced some time before the other sites.