Without resiling from last week’s criticism of how the headlines from AEMO’s 2019 Electricity Statement of Opportunities (ESOO) were communicated, it’d be churlish for me to fault the depth of disclosure and data sitting behind those results. Literally tens if not hundreds of thousands of hours of combined effort must have gone into the data, forecasts, modelling, and analysis that underlies the ESOO, and AEMO makes available an extraordinary amount of detail on it all.
This post covers only a tiny fraction of that detail but hopefully enough to bring out some key factors that drive the reliability assessment, and prompt some discussion about changes that AEMO is pushing for and perhaps on how we’ve got to where we are.
But one last beef – why call it something as impenetrable as the “Electricity Statement of Opportunities”? (Yes I know, that title’s probably mandated in some clause of the NER (what?) and requires a rule change proposal to be assessed by the AEMC (who?) to vary it).
But wouldn’t something like “NEM Reliability Forecast” be a lot more meaningful??
The key things I want to focus on in this post are:
- exactly how have the extended outages of Loy Yang A2 and Mortlake 2 in Victoria been treated and how do they affect the results?
- have AEMO’s load forecasts changed and is this driving the generally better reliability (or least lower expected USE) projected in this year’s assessment?
- what’s the story with outage rates for coal-fired generators – are they getting worse?
- how much new investment in what kind of generation would be needed to materially improve reliability?
- why and how is AEMO looking to change the way that reliability is defined in the NEM?
Let’s open the box then.
How has AEMO dealt with the current extended outages in Victoria?
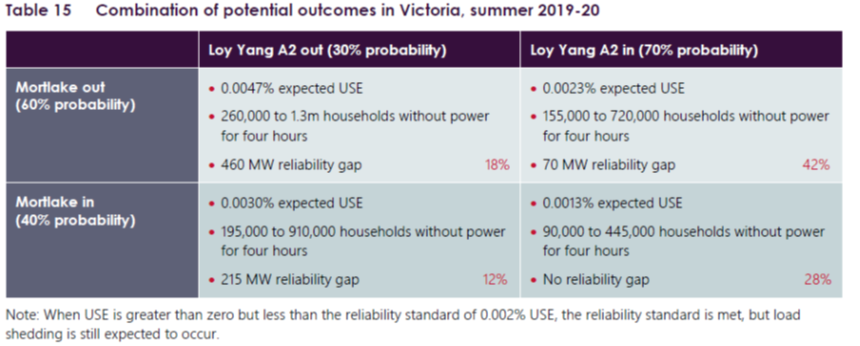
Whether Loy Yang A2 and Mortlake 2 are returned to service in time for the peak summer period (broadly early January to the end of February) will make a big difference to the reliability of the system in Victoria over summer 2019-20. While the owners of both generators have apparently reaffirmed their guidance on expected return dates this December, AEMO has decided to assess Victorian reliability this summer by assuming that there are still significant risks of delays at one or both plants. Four sets of scenarios with each of these units either in or out have been run, and the “headline” reliability figure for Victoria is a weighted average of these four sets of results, summarised in Table 15 from the ESOO:
NB – Don’t take the “numbers of households without power” literally – it’s unhelpful shorthand for the quantity of load curtailment that might be necessary under extreme conditions, but that curtailment would rarely if ever be delivered entirely through rolling blackouts. Also the footnote stating that “load shedding is still expected to occur” when expected USE is greater then zero but below the reliability standard is quite misleading – it should say that load shedding could still occur.
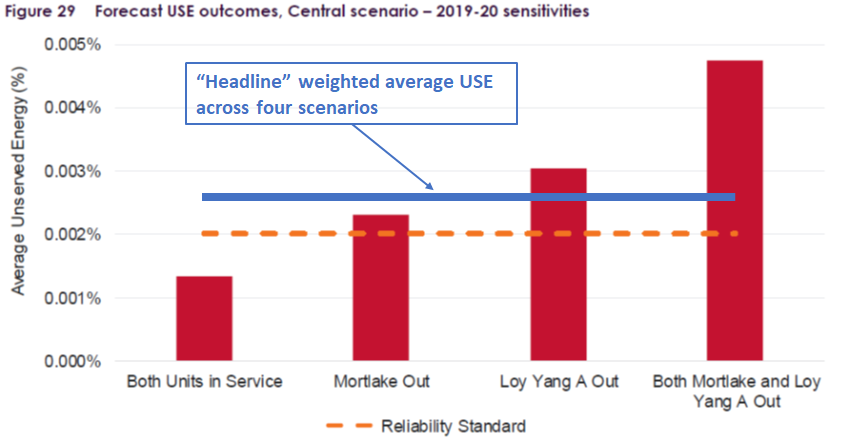
Graphically, these scenario results, measured in terms of expected Unserved Energy (hopefully I don’t have to remind readers what this term means!), look like this:
So if both units do come back into service by the advertised December dates, Victorian reliability this summer would fairly comfortably meet the NEM standard, but if both are delayed until the end of summer the (un)reliability measure would be more than double that standard.
AEMO has pretty clearly made a pragmatic call here to factor in some broad brush estimates around the chances of delay at both units. The quandrary AEMO faced in preparing the ESOO was that ignoring any delay risk and producing a result below the threshold could, under the NEM rules, leave few tools in its arsenal to deal with delays that did subsequently eventuate, through authority and lead time to contract with reserve capacity providers. Arguably it would also understate the nature of the reliability risks to the system given these extended and complex repair tasks.
It’s also notable that AEMO’s formal assessment assumes:
- no continued operation of two Torrens Island A units (2 x 120 MW) in South Australia over summer. These units were previously scheduled for closure in late 2019, however AGL has sought permission from the South Australian government to delay closure until March 2020. If approved, AEMO estimates that assessed USE levels in Victoria would fall by about 0.0006% to a level only just over the 0.002% Reliability Standard.
- the South Australian government’s emergency diesel generators (about 270 MW nominal capacity) will not be available to the market and only run as a last resort to avoid load shedding.
How have load forecasts changed?
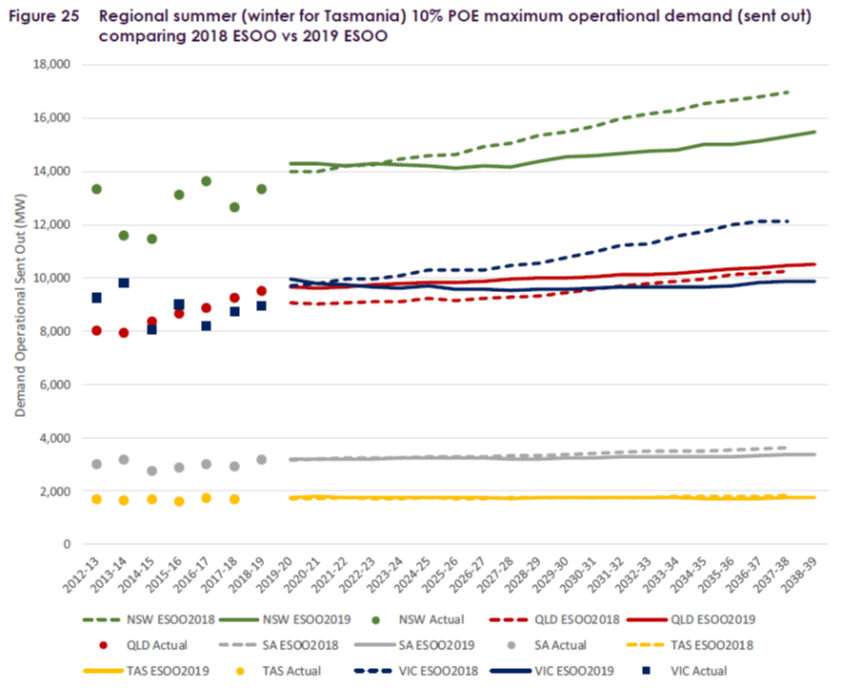
A major driver of reliability risks is the peak demand level projected in each region, particularly the so-called “10% POE” forecast or extreme demand peak that might arise in a very hot summer experienced once every ten years on average. Most of the load curtailment events in AEMO’s modelling are associated with demands at close to these levels (see p76 of the ESOO for instance). The following chart shows AEMO’s forecasts this year vs those in last year’s ESOO and recent actual demand outcomes
We should normally expect to see the 10% POE forecasts above recent actuals, since the forecasts represent a one in ten year outlier and the actuals reflect whatever weather we actually had. With the exception of Queensland which has seen strongly growing peak demands, the 2019 ESOO forecasts for next summer (2019-20) have not changed much since the 2018 ESOO, but are expected to grow more slowly in the out-years than previously forecast. This may be one reason for the generally better reliability forecast in this year’s ESOO than in last year’s.
Is coal becoming less reliable?
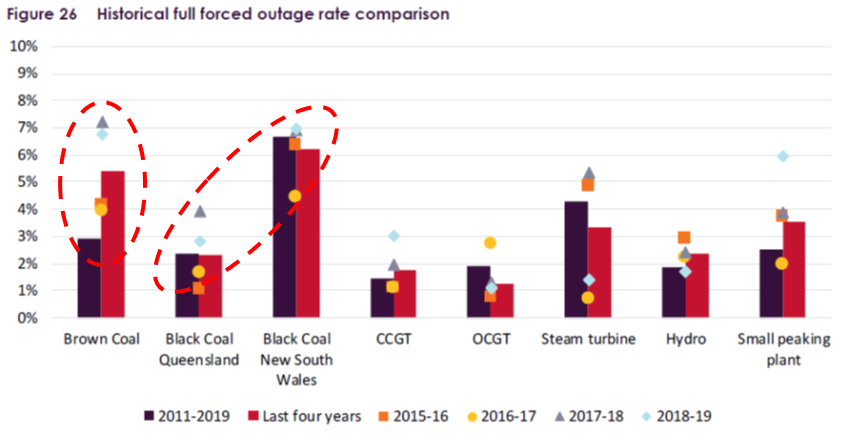
There’s been more heat than light on this topic in most public discussion (with the notable exception of the great work in the Generator Report Card by Global Roam and Greenview Strategic Consulting). AEMO has to quantify and support its own assumptions for the ESOO modelling and they make interesting reading. The chart that I think best summarises things is this one:
I’ve highlighted two key observations from this data which shows levels and trends in full forced outage rates across different generation types:
- brown coal plant reliability has fallen substantially over the past four years with the last two years being particularly poor
- while there’s no obvious time trend over recent years, there’s a very big discrepancy between black coal plant forced outage rates on different sides of the NSW-Queensland border
The first point has been commented on for some time, and emphasised by AEMO in both last year’s and this year’s ESOO (not to mention the real world impacts in January this year). I’m less aware of discussion of the second point, and would be fascinated to hear of any reasons why there’s a threefold difference.
How much would new generation improve reliability? (or How much new generation would improve reliability?)
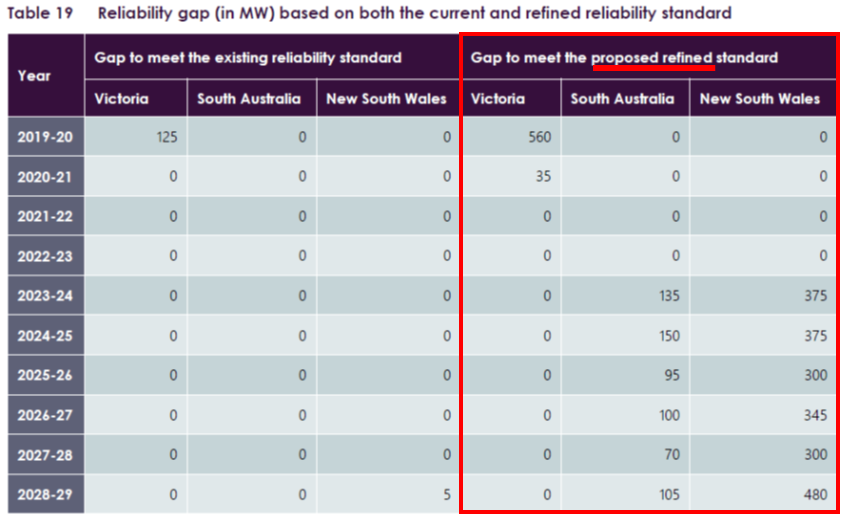
Given the fairly apocalyptic coverage of the ESOO results, and loud calls for “like for like” replacement of every plant that might retire (and perhaps even those that have already retired), it’s surprising that not very much additional firm capacity would need to be added into AEMO’s modelling to produce results that are in line with either the current reliability standard, or even an enhanced standard that AEMO would like to see (more on this below). This is best summarized in this AEMO table:
Under the current reliability standard, AEMO’s modelling says 125 MW of new firm capacity in Victoria this summer is all that’s needed. For the next ten years. Across the whole NEM! (And that’s assuming two Torrens Island A units don’t operate over this summer; otherwise that 125 MW number would vanish as well.)
But summer blackouts? And what about Liddell closing by 2023?? No breach of the standard according to current methodology! Now to be fair “no breach of standard” is far from the same thing as “no risk of blackouts” (or load curtailment). And this is probably a major driver for AEMO’s push for an enhanced reliability standard, under which the extra firm capacity levels in the right hand half of the table would be required (these amounts are single year levels and shouldn’t be added up – a single investment in 500 MW of permanent firm peaking capacity in NSW in time for 2023-24 would be sufficient to cover all years in the horizon.)
It’s also worth pointing out that AEMO’s forecasts here assume ongoing investment in rooftop PV and completion of a number of large scale renewable projects currently under or committed for construction (including Snowy 2.0), but don’t yet include things like the transmission upgrades required to reliably deliver Snowy 2.0’s capacity to market or to improve transfer capacity between regions, because these upgrades are not yet categorised as firmly committed under the NEM’s labyrinthine transmission investment regime.
So why ask for an enhanced Reliability Standard?
It’s fairly hard to believe we would be having the debate we are having if such small capacity additions as those indicated in the table above would truly “fix the reliability problem” by getting us under the current reliability threshold.
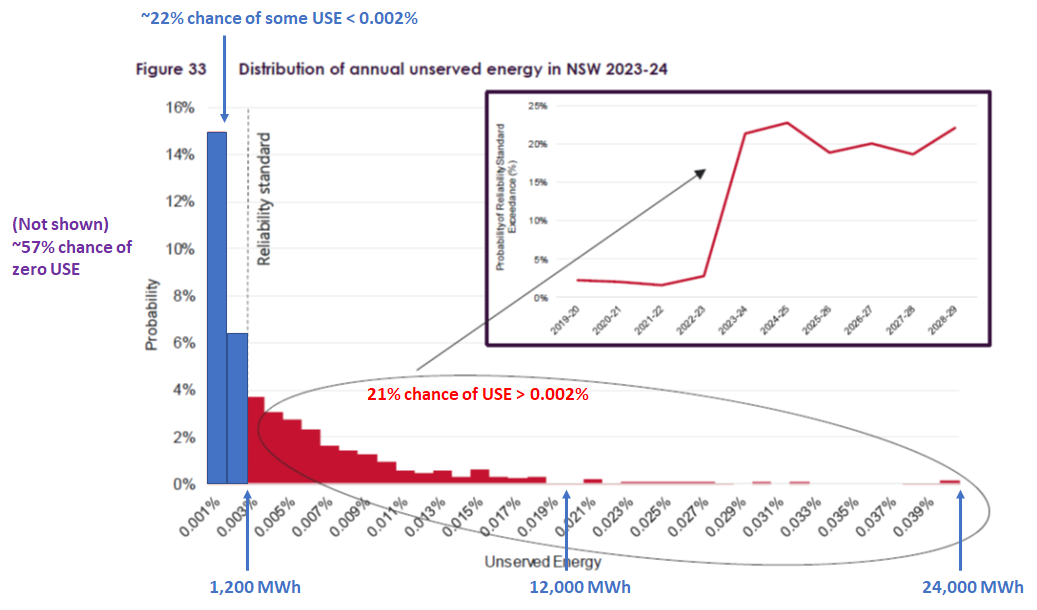
AEMO has evidently come to this view and in this ESOO and a number of other recent submissions has tried to draw attention to the broader dimensions of reliability. Here’s an example, namely a chart showing the probability distribution of unserved energy (USE) across a set of scenarios run for NSW in 2023-24, the summer of which follows assumed retirement of Liddell:
I’ve made a number of annotations to try to better explain this chart. The bars represent results of individual model simulations (out of the thousands run for this year) grouped or “bucketed” into load curtailment amounts along the horizontal axis. Location along this horizontal axis is the amount of load curtailment in each bucket (expressed as percentage USE, but I’ve overlaid absolute quantities in megawatt-hours). The height of each bar on the vertical axis is the proportion of simulation results falling into that USE bucket. The chart excludes the roughly 57% of simulation results with no load curtailment at all. Roughly 22% of the simulation results (which I’ve coloured blue) have some USE but less than the current 0.002% threshold which is about 1,200 MWh for NSW.
The remaining 21% of simulations coloured red have levels of USE greater than 0.002%, right up to a whopping 24,000 MWh which is very roughly two hours of all demand in NSW on a hot summer day. (Note that the chances of this outcome are tiny, indicated by the low height of the bar).
But remember from the table in the previous section that AEMO’s analysis showed that no additional capacity is required to meet the current 0.002% reliability standard in NSW for this year.
This is because the reliability standard is framed in terms of expected USE, where “expected” has a precise mathematical definition not as “likely” or “reasonably possible”, but as an average, probability-weighted across all scenarios including those with no USE at all. So comparing amounts of curtailment in individual simulation results, or buckets of results, to the 0.002% standard as AEMO has done here is really an apples to oranges comparison.
But AEMO is arguing that framing the standard purely in terms of oranges – statistically “expected” USE – runs the risk of having too many bad apples: outcomes with “unacceptably” large amounts of load shedding.
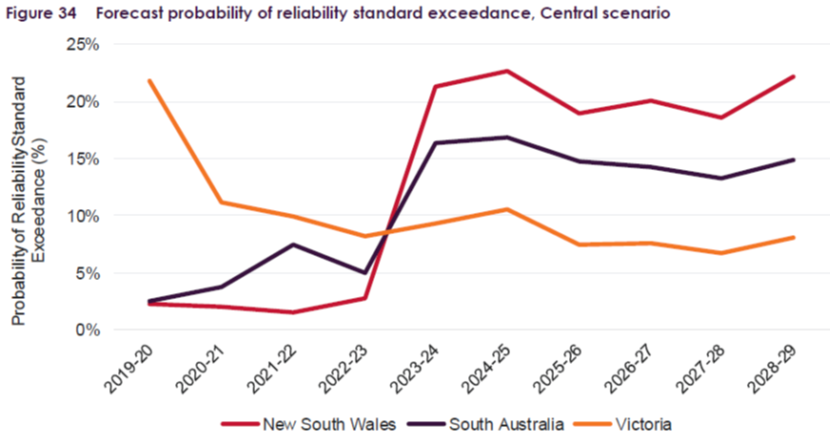
AEMO is therefore arguing that the 0.002% threshold should be re-purposed away from being a mathematical construct to a more tangible level of load curtailment whose risk of exceedance should be less than a 10% chance – the chart above shows that the chance in NSW for 2023-24 is 21%, well above this level. The following chart from the ESOO shows that the proposed enhanced standard would be breached, or close to breached, in the south east mainland regions from 2023-24:
This is not the place to get into discussions about what represents “unacceptably” large amounts of load shedding, what the cut-off and its probability ought to be, or whether AEMO’s suggestion is the right solution, but I hope it does at least explain why AEMO has concerns about the current framework, and has assumed its current far more active role in the reliability debate.
——————————————-
About our Guest Author
 |
Allan O’Neil has worked in Australia’s wholesale energy markets since their creation in the mid-1990’s, in trading, risk management, forecasting and analytical roles with major NEM electricity and gas retail and generation companies.
He is now an independent energy markets consultant, working with clients on projects across a spectrum of wholesale, retail, electricity and gas issues. You can view Allan’s LinkedIn profile here. Allan will be sporadically reviewing market events here on WattClarity Allan has also begun providing an on-site educational service covering how spot prices are set in the NEM, and other important aspects of the physical electricity market – further details here. |


I wonder why Ms Zibelman puts the boot into thermal plant without also mentioning weather dependent intermittency?
Also no mention of Basslink which has been offline twice in 3 months.
I note the recent UK experience where 1000MW loss of generation capacity resulted in 500MW of behind-the-meter generation, thus necessitating greater response which ultimately included significant blackouts.
AEMO, IMHO, should specifically allow for loss of embedded generation in their ESOO models, yet I have seen no mention of that.
John
Thanks for the comment. I tend to agree with your analysis of the recent UK event, but note that was a “system security” problem – real-time robustness of the grid against a sudden transmission or generation failure.
The ESOO does not deal primarily with this kind of risk but with “capacity adequacy” – having sufficient dispatchable capacity (generation and potentially demand response) to deal with *forecast* future levels of demand. Unavailability of generation is allowed for in the analysis, based on known outages and failure statistics, but the ESOO modelling itself does not pretend to assess the second-to-second robustness of the system against outages. So things like “cascading” failures don’t need to be explicitly modelled for the ESOO. However the models do incorporate many constraints (for example on interconnector flow levels) that ultimately reflect system security considerations.
Allan
Alan,
Re “why call it something as impenetrable as the “Electricity Statement of Opportunities”? I would add why do such documents always get moved to locations in the bowels of AEMO’s web site often requiring hours of searching to locate since such moves always seem to lead to any previous links being broken. it is often quicker to google the document than search on AEMO’s website.