An increasing number of people are referring to what’s happening currently along the lines of ‘worst Energy Crisis in 50 years!’ (referencing back to the global oil shock of the 1970’s).
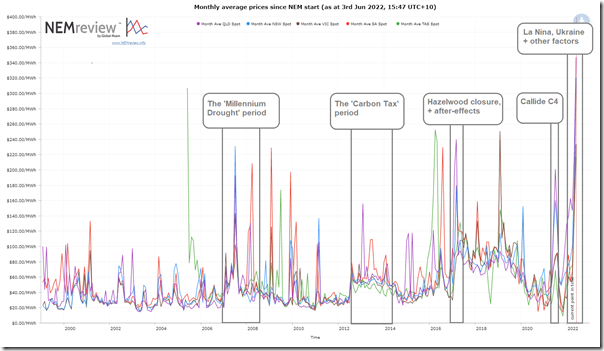
To put that type of comment into context (though keeping in mind that the NEM only began on 13th December 1998) I thought it would be useful to start with this long-term trend of monthly average spot prices in the NEM since the start of the NEM:
For those who want to access this trend, the pre-prepared query is here … for those with their own licence to NEMreview.
I’ve highlighted a couple periods in NEM history in which we saw internal or external factors drive monthly average prices away from the underlying pattern. It’s clear to see that the run-up in prices seen in the past couple months is unprecedented in NEM history … and hence quite concerning for what the future holds.
With respect to the headline events highlighted, here’s a few nots to start (with links to more):
|
Headline Event |
Description |
|---|---|
|
‘Millennium Drought’ 2007-2008 |
This was first felt in the NEM in early 2007 and lasted into 2008. Not only were hydro facilities affected (across Tasmania, Snowy Hydro, Southern Hydro and Wivenhoe), but we also saw a number of thermal stations (particularly coal generators) placed on severely restricted output for many months due to severe shortage of cooling water. — This period occurred right at the beginnings of this WattClarity® service, so there were not so many articles written about what was happening at the time. We created this ‘Headline Event’ category to collate relevant articles, but not many are there at this point.
|
|
‘Carbon Tax’ period July 2012 to June 2014 |
For a two-year period under the Gillard-led Federal Labor Government, the NEM was impacted by an economy-wide carbon pricing scheme – which became known as the ‘Carbon Tax’. — On WattClarity articles written with respect to this period are generally tagged with ‘Carbon Tax’. |
|
Hazelwood Closure late 2016, April 2017 and afterwards |
The Hazelwood power station was closed at the end of March 2017. There had been other coal-fired station closures, but this was the event that had an outsized and long-lived impact on various aspects of the market (including prices above) because of a number of factors, including two main ones: 1) The much larger volume of energy generation that was ‘lost’ when the plant closed (compared to the earlier smaller, and lower capacity factor coal units that closed); and 2) The short notice of closure – which did not give the market time to prepare to replace such a large volume of energy. Amongst articles here about Hazelwood were 1) this on 2nd November 2016 about potential price impacts (a day before the announcement) and on 3rd November about supply-side impacts (after the announcement); and 2) discussion of the aftermath of the closure decision with futures prices escalating in March 2017; and 3) about simplistic claims of ‘gaming’ that arose from the price escalation that resulted. |
|
Callide C4 25th May 2021 and afterwards |
On 25th May 2021 there was the Callide C4 Catastrophe, which began with major technical problems at the Callide C4 unit in central Queensland, leading to both: 1) An explosion of the unit causing major damage and a very long unit repair time; and 2) A cascading series of events that led to under-frequency load shedding (UFLS), islanding of the QLD region and very high prices through the afternoon/evening … carrying into subsequent days. This event formed an inflection point in market prices which has transitioned further into the 2022 Energy Crisis. |
|
‘Worst in 50 years Energy Crisis’ particularly April 2022 onwards |
I’ve created now this ‘Headline Event’ category to cover articles looking more broadly at this 2022 Energy Crisis … including this one. We can see from the chart above that this energy crisis really began around the time of the Callide C4 explosion – but has escalated significantly since that time. |
That’s all for now, but more articles will come about other aspects of this Energy Crisis.


Would be good Paul if you added a colour legend for the various States in the NEM. I make them – NSW Turquoise – Qld pale purple – SA Red – Tas Green – Vic Brown.
Thanks for Wattclarity info over years.
Sorry, fixed – left it off by mistake
Hello, can you explain what snowy 1 has contributed during the current crises. My understanding is that SH 1 was designed to step-in to supply during such crises.
I have not heard a peep from SH to say it was on duty. Or in response to the white elephant claims by media commentators.
Thi is very unsatisfactory. Thanks Bill
This leads to distrust in what snowy 2 will do
Bill
Whilst we (the general population) might have intense interest in what’s happening inside the wholesale market during this crisis, and so might think that the participants in the market should be doing more to talk about what they are doing, it’s important to keep in mind that their first duty is to do whatever they can to help AEMO keep the lights on … which might mean their communications come a distant second.
It’s unfortunate that some take silence (most likely just because of busyness) to leading to … ‘distrust in what snowy 2 will do’.
In terms of what Snowy Hydro has been doing, coincidentally Ben Kefford from KPMG has posted some interesting analysis here on LinkedIn:
https://www.linkedin.com/feed/update/urn:li:activity:6944212641888243713/
… that might satisfy some of your appetite.
Paul