Last Tuesday (29th Sept) our 19th Case Study in the series was published – looking at the 17:05 dispatch interval on Friday 5th April 2019. This was a time where Semi-Scheduled units collectively underperformed by more than +300MW (+346MW on that instance).
* in terms of ‘extreme events’, we’re specifically looking at Dispatch Intervals where there has been:
Scenario 1) more commonly ‘large’ collective under-performance across all Semi-Scheduled units (being measured as Aggregate Raw Off-Target > +300MW); or also
Scenario 2) much less frequently ‘large’ collective over-performance across all Semi-Scheduled units (being measured as Aggregate Raw Off-Target <-300MW).
Today we only have to wind the clock forward just 3 days to the other side of the weekend – almost exactly at the same time of the day – for this 20th Case Study.
(A) Background context
Remember that we identified a total of 98 discrete instances where aggregate Raw Off-Target across all Semi-Scheduled units was either:
(a) above +300MW (representing collective under-performance) or, much less commonly,
(b) under –300MW (representing collective over-performance relative to AEMO’s expectations, seen in the Dispatch Target).
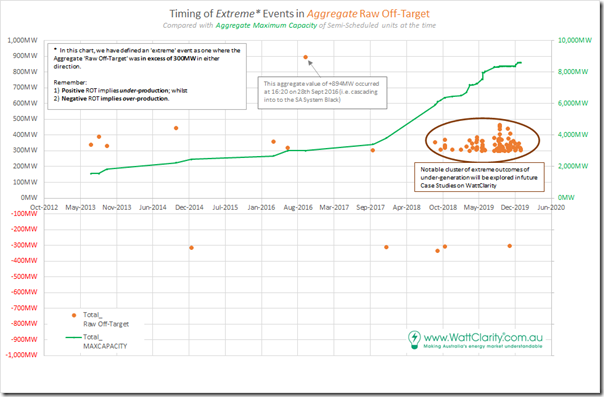
There was a smattering of only 10 cases through 2013, 2014, 2015, 2016, 2017 and through until August 2018. However thereafter (to the end of 2019) there was a sharp escalation of extreme incidents – as seen in the following chart:
Note also that we have not yet looked into 2020 data, which will be the focus of the GSD2020 (so we can’t comment on whether the trend from 2019 has continued to grow).
We commenced this particular run of Case Studies after being given a push from the AER Issues Paper on 24th June (noting that the AER handed the AEMC their proposed rule change on 30th September), and so far have walked through the sparse instance of extremes from 2013 all the way up into 2019. However now we’re in the thick of a much larger cluster which will take more time to work through – though we will persist, as it’s important.
We’re investing so much time in these particular pieces of analysis because we see it as important to the underlying challenges that ‘NEM 2.0’ will need to address.
The ‘NEM 2.0’ challenge we see is much broader the AER’s Proposed Rule Change which focused specifically on Semi-Scheduled response to negative prices – and we do note that submissions are due on Monday 19th October (only 2 weeks away). We’ll try to get through as many of these specific instances as possible in order to contribute as much as we can by Monday 19th October.
Readers need to keep in mind that there are other challenges with Semi-Scheduled plant that we’re not even trying to delve into in via this particular run of Case Studies, such as:
Other Challenge #1) Within the dispatch interval timeframe, energy-related services focused on frequency maintenance and response to contingencies;
Other Challenge #2) Relating to ‘firmness’ of supply in the broader forecast horizon; and
Other Challenge #3) Others that we bundled into a ‘keeping the lights on’ services category in our discussions in the Generator Report Card 2018 (for instance, in relation to System Strength).
In preparing these focused Case Studies, we’re seeking to understand why and what the implications are of this escalation.
(B) Looking just at the 16:55 dispatch interval
It seems clear to me that there’s no coincidence that we’re starting to see more of these extreme intervals appearing at the end of the daylight period – this case occurs at 16:55 whereas the Friday beforehand it was 17:05.
Not only is the ramp rate required for dispatchable plant increasing quickly to cover the ‘sundown’ effect as solar scales aggressively – it seems clear that we’re facing increasing uncertainty about how much dispatchable energy is going to be required in these dispatch energy. With so much capacity moving around at the same point in time, NEM operations is becoming increasingly more complex.
Q) Is the Semi-Scheduled category, as it currently operates, fit for purpose as more solar capacity scales?
A?) I have significant doubts – and will be interested to see what results there are in 2020 as part of the next update to the Generator Report Card to suggest whether the advent of self-forecasting, on its own, will be enough.
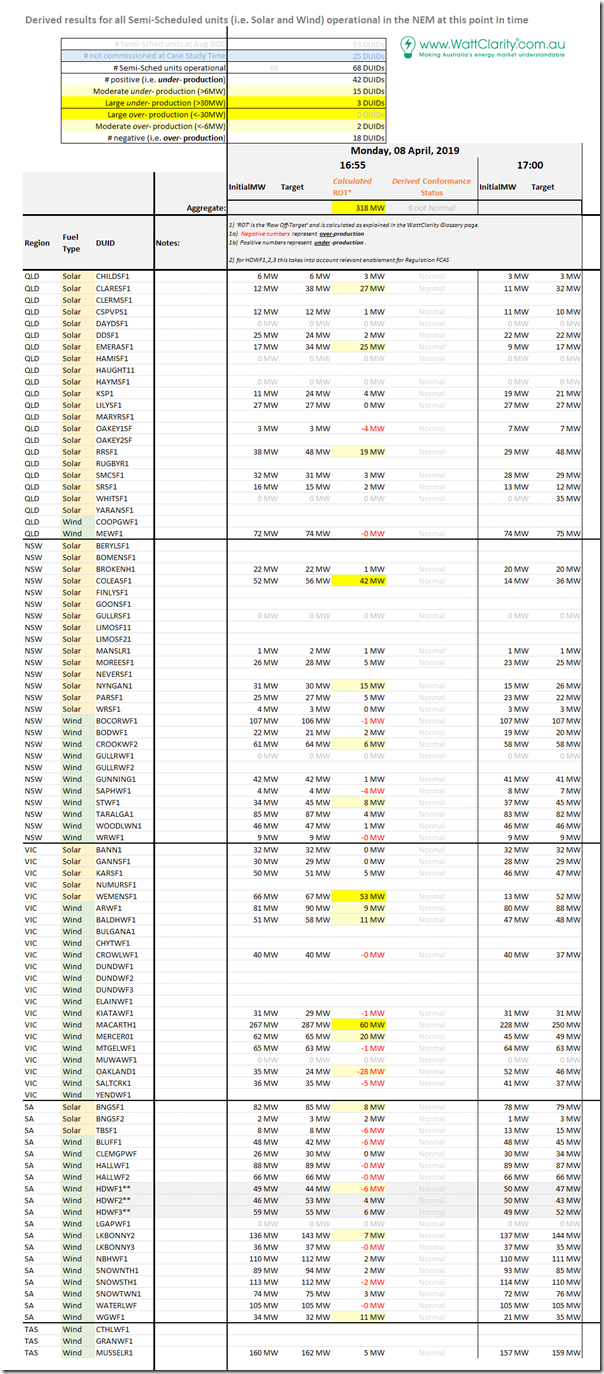
Here’s the same tabular framework of results for individual Raw Off-Target performance of all 68 x Semi-Scheduled units that were operational at the time:
In summary from this table, we can see the following:
1) Of the 68 DUIDs registered at the time, there are 233% the number under-performing (42 DUIDs) as there are over-performing (18 DUIDs):
(a) Looking just at Large Solar Farms across the NEM, we see 1,115% the number under-performing (23 DUIDs) as there are over-performing (2 DUIDs).
(b) In contrast, looking at Wind Farms across the NEM, there is less imbalance, though still a slight skew (19 DUIDs under-performing compared with 16 DUIDs over-performing).
2) Across both Wind and Solar units highlighted as having Raw Off-Target greater than 6MW (a threshold that is one of the inputs in determining Conformance Status for a unit), we see the split is unbalanced:
(a) 8 DUIDs flagged as under-performing by at least 6MW (with 2 of these under-performing by more than 30MW); whilst
(b) Only 2 DUIDs flagged as over-performing by at least 6MW (with neither over-performing by more than 30MW).
… which is the very skewed ratio we’re becoming used to seeing in many in this particular run of Case Studies.
One more reminder of how the commonly touted belief that I might paraphrase as ‘the unders and overs will average out’ just does not hold true, at least in many of these extreme events.
(B1) Units showing large Raw Off-Target Results
We’ll start with the three DUIDs that show Raw Off-Target of greater than 30MW, a quite significant deviation for an individual unit. Remember that the choice of what’s ‘large’ is a little subjective – however I have based it on two things:
Criteria #1) Practical considerations, like my time constraints in drilling into each instance – not to mention my sense of a reader’s patience in working through these articles;
Criteria #2) More holistically, though, I have also made the choice based on the fact that 30MW has been the historic threshold where a dispatchable asset must be registered with the AEMO and operate as a Scheduled Generator. Keep in mind that the registration threshold for a battery is 5MW (i.e. it was seen that 30MW was too large a tolerance for invisibility).
… so for now 30MW seems a good criteria for me to also use in looking at the growing number of invisible, and quite random ‘phantom generators’ we have entering the NEM which are operating as the ‘evil twin’ of a Semi-Scheduled generator which would be fully predictable in a dispatch time horizon through the AWEFS and ASEFS processes.
With this in mind, let’s have a look at the 3 DUIDs which had large ‘phantom generators’ coupled with what was expected in NEMDE to deliver large unpredictability. Two of these were solar, but one was wind:
(B1a) Coleambally Solar Farm in NSW (under-performance by 42MW)
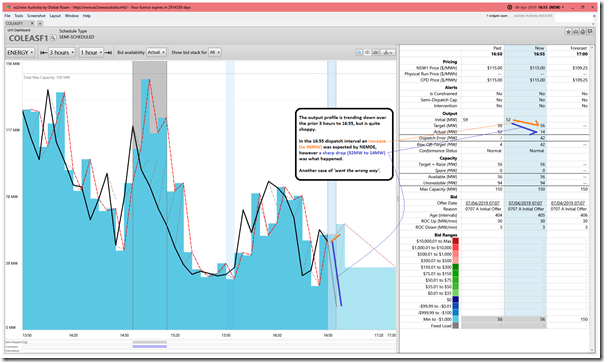
With the snapshot from ez2view below (using the ‘Unit Dashboard’ widget in an internal copy of version 8 I’m using to test out other new functionality) we see the following situation for COLEASF1:
With respect to COLEASF1 we can see:
Observation #1) As the sun wanes on this autumn afternoon, the output has been trending down – however it’s clearly been quite bumpy through this descent (probably due to cloud cover?).
Observation #2) The 16:55 dispatch interval is clearly a case of ‘repeat went the wrong way’ with:
#2a) NEMDE expecting a small increase to 56MW; but instead;
#2b) A sharp drop (54MW to 14MW) eventuates;
#2c) Which results in the Raw Off-Target value of +42MW.
(B1b) Wemen Solar Farm in Victoria (under-performance by 53MW)
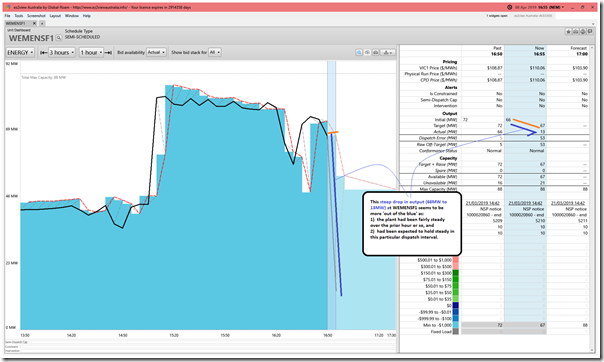
An even larger deviation is shown for WEMENSF1, south of the border in VIC:
With respect to WEMENSF1:
Observation #3) This is a different case to COLEASF1 as we see the output had been fairly steady over the past hour or so – much more a case of ‘out of the blue’.
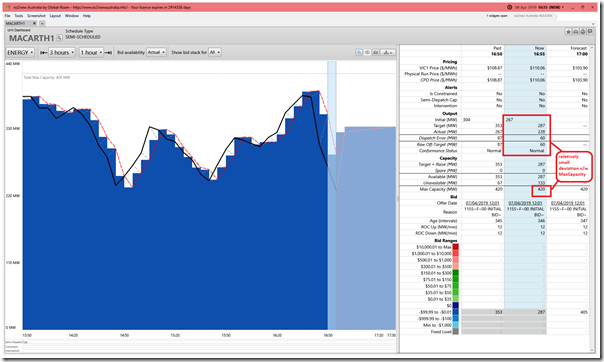
(B1c) Macarthur Wind Farm in Victoria (under-performance by 60MW)
Keep in mind that we already named MACARTH1 ‘worst performer’ of any DUID in the NEM throughout CAL 2019 when we released the GSD2019. Hence it’s not really a surprise that MACARTH1 is featuring in many in this particular run of Case Studies..
Here’s how it looked for this particular dispatch interval:
It’s worth briefly highlighting two things here:
Observation #4) This is another case of ‘went the wrong way’ compared to NEMDE’s expectations.
Observation #5) In this case, the size of the Raw Off-Target (i.e. +60MW) appears relatively small, but that’s due to the large size of the unit. It seems clear that the large size of MACARTH1 is one of the contributing factors to why it’s performance was much worse than the other wind farms by the ‘Raw Off-Target measure.
(B2) Units showing smaller (but still significant) Raw Off-Target Results
That’s not the end of the story, however…
Observation #6) In between the 3 units above the aggregate under-performance was 155MW – which still leaves more than half of the total 318MW under-performance spread across the remaining units. That’s a sizeable residual ‘phantom generator’.
Observation #7) This discrepancy was mostly contributed by the 12 other units which were Raw Off-Target greater than 6MW but lower than 30MW:
#7a) Remember that all 12 of these have discrepancy levels large enough to be equivalent to what the AEMO sees as one criteria for Conformance Status being away from ‘Normal’.
#7b) Hence none of the discrepancies are trivial – especially when DUIDs were overwhelmingly under-performing.
#7c) Of these remaining 12 DUIDs:
i. two solar farms and one wind farm were greater than 20MW (CLARESF1 = 27MW, EMEARSF1 = 25MW whilst MERCER = 20MW); whilst
ii. two other solar farms, and two wind farms were greater than 10MW (RRSF = 19MW, NYNGAN1 = 15MW and BALDHWF1 = 11MW, WGWF1 = 11MW)
iii. the single large over-performance at OAKLAND1 (-28MW) at least helped to ensure that the total was lower than it would have otherwise been.
#7d) A key lesson, here, is that the smaller discrepancies add up to something big when there is such a skew in results and most units are under-performing at the same time.
One more reminder of how the commonly touted belief that I might paraphrase as ‘the unders and overs will average out’ just does not hold true, at least in many of these extreme events.
That’s all I have time for now…


Be the first to comment on "Case Study of 16:55 on Monday 8th April 2019 (aggregate Raw Off-Target +318MW for Semi-Scheduled units)"