It was almost 2 months ago that I posted – back on 14th August – about ‘What effect has Stage 4 Lockdown in Victoria had on electricity consumption in the NEM?’. My intention, at the time, had been to quickly progress into a summary of some of the risks that were apparent to me at that time … but unfortunately these intentions met with the reality of commitments to current clients, and you know which took a back seat.
Time has marched on, and it certainly feels like it’s closer to summer than winter in Brisbane these days. Some of these thoughts have still be rattling around, but I have not had a chance to really think them through properly.
So (for a couple reasons) I’m dumping them here in this article as a way of clearing space in my head for other things that need. These are only partially thought through, so might be useful – or they might not….
(A) Physical risks
There are a bunch of risks relating to physical grid, and it’s always important we start there.
Before getting into details, it’s worth reminding readers of the difference between probability and consequence, and how they both combine to define risk (three different measures that seem to be increasingly confused with each other).
(A1) Generation Infrastructure
(A1a) Risks at the large generation plant
There’s lots of activity in the new entrant wind and solar space but, as noted in the Generator Report Card 2018, the lion’s share of the energy consumed in the NEM is still supplied by 48 discrete coal-fired units in the NEM across VIC, NSW and QLD.
… hence, it’s understandable to focus on risks relating to these plant individually.
Furthermore, because of the lower number of large supply units in Victoria since the closure of Hazelwood, the consequences that would be faced if any were disrupted would naturally be higher. As Allan O’Neil noted here in unpicking the ESOO 2020, the risk for summer 2020-21 is seen by the AEMO to be larger in Victoria than it is in NSW and South Australia (with QLD and TAS not even shown because the risk was lower still).
… hence it’s understandable that there might be more concern in VIC than elsewhere.
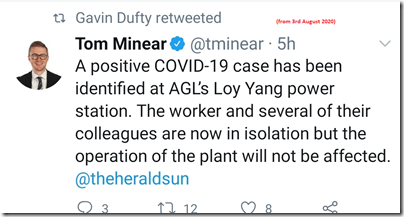
Earlier this year, we spun up a small team specifically focused on the development of an ‘Asset Catalog’ (more broadly focused than the ‘Generator Catalog’ we’d been tinkering with for some time beforehand). Even with this added focus, this tweet from 3rd August claiming a worker at Loy Yang A had tested positive was the only one I’ve seen about infection at key generation sites:
Using the criteria above (i.e. coal, and the 3 big stations remaining in VIC) the concerns that might pose were understandable.
My sense is that the risk does not so much relate to an alarming ‘COVID runs amok inside major generator sufficient to impact supplies’ story (which would be a low probability event given the precautions that were in place), but moreso about the way COVID precautions might impact on these same assets, as follows:
1) Firstly, some maintenance that would normally have been conducted following the heavy duty service provided through summer 19-20 was deferred in the autumn due to COVID concerns.
2) This maintenance would ideally need to be completed prior to the coming summer – but best not during winter, due to the peak in demand experienced then. As a result:
(a) We’ve crunched two outage seasons into one … or deferred into 2021; and
(b) We’ve made outages more complex processes by the added precautions that need to be taken with the employee + contractor workforce onsite during these outage periods.
… for instance, we did notice this update on LinkedIn last week by Greg Jarvis at Origin talking about some of the added complexities in performing maintenance at the Darling Downs CCGT in QLD.
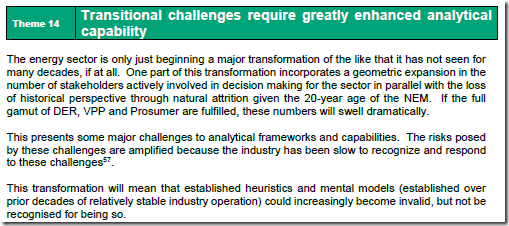
It’s worried us for ages (years, really) that the broader market has had no real visibility of forward-looking outage plans for the significant contributors on the supply side (except aggregate for a region in MT PASA). This concern was one of the many factors that contributed to the exploration in Theme 14 within Part 2 of the 180-page analytical component within the Generator Report Card 2018:
Thankfully (as a result of the ERM Rule change proposal approved by AEMC) we started seeing unit-level availability numbers for all Scheduled Generators (but, crazily, not Semi-Scheduled generators*!) about 6 weeks ago now. We’re in the midst of incorporating this new data set into our ez2view software in various ways, but already it is helping to provide some (long overdue!) visibility to market participants companies via software like ez2view.
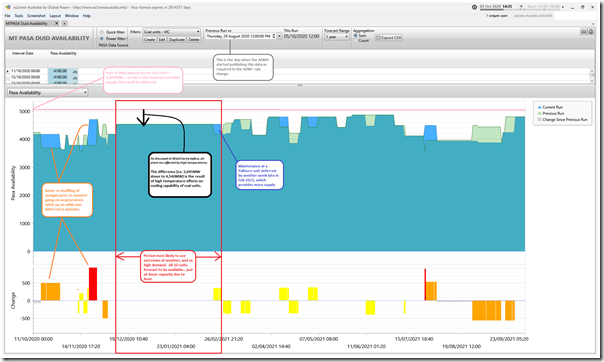
For instance, here is an aggregate view of the MW capacity forecast to be made available on each of the days out the coming 12 months across the 10 x brown-coal units in VIC:
Referencing what I wrote back in February about ‘extreme temperature effects on generation supply technology’ we need to remember that coal units are amongst those which are affected – though keep in mind that:
1) The impact is in terms of its peak output capability, due to reduced cooling efficiency; but
2) There is no evidence I have seen that would demonstrate that coal units have higher probability of tripping in the heat (i.e. that distinction between probability and consequence again for those prone to misinterpretation!)
As would be expected, we see an amount of jockeying for in-demand outage slots both before the peak summer period and afterwards – but that the full component of 10 units is planning to be fully available (heat adjusted) in the period most likely to experience extremes in temperature from mid December through until late February. The concerns for these (and other) ‘work horse’ units relating to summer 2020-21 are related to the following:
Concern #1) Given the (already) disrupted preparation period, will they be ready in time for summer?
Concern #2) Given the compressed outage period, we see outages stacked up right until Friday 11th December. What happens if there is a hot spell earlier than expected?
Concern #3) From time to time plant can experience technical failure, for whatever reason. If this were to happen now in the period from now till the end of summer, the repair process would be more complicated due to COVID concerns.
—
Somewhat ironic that there was an attempt to delay the publication of this data (which is very useful to participants to help manage the risks of COVID), with the reason being given for the considered delay was added workload due to COVID!
(a) I’m certainly grateful that the data is available, as are others we know of – just looking forward to the data formally being in a formal upgrade to the MMS.
(b) Looking forward to having the above released in ez2view shortly.
(A1b) COVID risks with new entrant Wind and Solar plant
Whilst individually the new wind and solar plant supply a lower share of the energy consumed in the NEM through summer, in aggregate they make a significant contribution.
When Allan compared the ESOO 2020 with the ESOO 2019 one of the differences was the larger number of new entrants forecast to be ready for summer 2020-21 than was the case a year ago. This, in turn, led to a lower risk forecast of Unserved Energy.
However, just as maintenance plans for existing generators have been disrupted due to COVID, so have the construction and commissioning schedules of these new entrants:
1) Both due to the same sorts of impacts on the personnel directly involved;
2) But also, I presume, as COVID has added another level of distraction to the broader process of generators demonstrating the necessary technical acceptances during the commissioning processes (which were already subject to a log-jam even without the added complication of COVID).
… as a result, it makes it clear that there is another concern …
Concern #4) What happens if some of this counted-on capacity is not ready to supply at times when it’s really needed?
With this concern in mind, I’d reiterate what I said above (*) in that it seems perplexingly, shoot-yourself-in-the-foot crazy to not have also required the new DUID level availability forecasts to also be published for Semi-Scheduled plant as well. Am I missing something here?
(A2) Transmission/Distribution Infrastructure
Risks relating to infrastructure also extend into transmission and distribution infrastructure. Particularly with respect to Victoria, it might be useful to remind some readers that the main trunk of the transmission infrastructure which was blown over so spectacularly on 31st January 2020 has still not been fully replaced:
1) What’s operating now is a ‘temporary’ measure aimed to help us get through to when the replacement line is fully up and running. These temporary structures have lower levels of redundancy and lower strength than the permanent network.
2) Complicating the outage schedule above, is the overlapping plans to commission and return to service this new line in the weeks ahead leading into summer.
Concern #5) What happens, here, if something does not go to plan?
(A3) Consumption Side
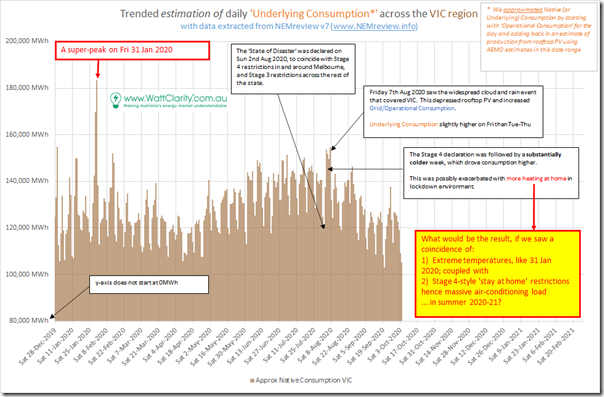
When I wrote this article about COVID in Victoria on 14th August I started the trends of estimated Underlying Consumption at 1st February 2020 – which happened to be the day after the doozy that was 31st January 2020:
Extending the chart backwards to the beginning of summer 2019-20 (and losing the earlier years) adds in the ‘super peak’ level of approximated Underlying Consumption for the day – which then raises a pretty obvious question:
Concern #6) It looks like we’re in for a La Nina summer this time, which (I think?!) means less chance of such extreme temperatures as Victoria experienced on 31st January 2020. However the levels of demand that would transpire in summer 2020-21 if any region were to be locked down with ‘Stage 4’ style mandatory ‘stay at home’ restrictions coincident with extremes in temperature like VIC saw on 31st January 2020 does give some cause for concern.
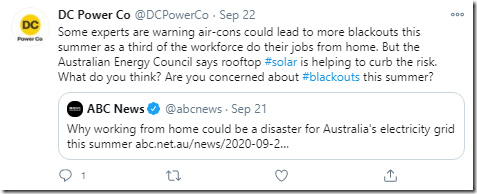
I note that I am not the only one to have been thinking about this possibility. For instance, I saw this tweet from DC Power Co referencing an article on ABC by Emma Elsworthy on ‘Why working from home could be a disaster for Australia’s electricity grid this summer’:
(B) Financial risks
On top of the above, there are other risks that might start out more in the financial/commercial domain, but could possibly transfer through to the physical grid if left unmanaged. These proceed along the following lines:
Step 1 = due to COVID-related economic downturn, two related things happen:
1a) Some energy users reduce their energy consumption … noting that this has been seen to be typically commercial load, not industrial or residential load:
1b) A significant number of energy users have problems managing cash flow – which, amongst other things, impacts on their ability to pay their electricity bill.
Step 2 = the tapering of support payments via Job Keeper and Job Seeker (and other mechanisms) increases the stress.
This is especially topical now, given the Government’s Budget being released tomorrow, and questions about what exactly is going to happen.
Step 3 = some step-change shock emerges (which might be another wave of COVID and related lockdown somewhere, or the evaporation of Government support, or some other factor) leads to many energy users unable to pay their bills at the same point in time.
Step 4 = lockdown coincident with hot weather drives at-home electricity consumption above levels that retailers have hedged.
Step 5 = because of higher-than-forecast demand (and potentially even issues on the supply side) wholesale prices skyrocket, driving some participants to the wall.
Step 6 = a double-whammy of higher than forecast consumption at customers that are have trouble paying leads to real stress for retailers:
This might particularly occur for those focused on the residential sector, and with less mature hedging operations.
B1) Risks to retailers, small and large
We’ve seen a number of examples written to suggest some stresses in this respect – the following is just a smattering but we’re sure that there are more:
B1a) Stress at Click Energy … acquired by AGL Energy
In their article ‘Amaysim offloads energy business to AGL’ in the AFR on 1st September 2019, James and Angela note that a higher load of bad debts with their customers due to COVID-19 was one of the factors that:
1) May have influenced the decision to offload the business; and
2) Almost certainly reduced the sale price for the business.
B1b) Stress at Origin Energy
On the 5th August in the Australian, Perry Williams contributed the article ‘COVID demand slump hikes pressure on coal – Origin’s Frank Calabria says’. In that article there is the quote that:
“Origin saw electricity demand fall by up to 20 per cent for some customers during the COVID-19 shutdown …”
… referencing an earlier article on 25th June. Readers should take keen note that this result occurred only for some customers, whereas doomsday predictions were well off the mark. What matters more, for individual retailers, is that these drops in consumption might have meant lower profitability for these customers and broader impacts on their business.
I also saw Antony Stace make this comment on LinkedIn, referencing this article on RenewEconomy.
B1c) Stress at Flow Power
My understanding is that Flow Power, as a retailer, focuses more on the C&I sector than the residential sector. So perhaps some of the concerns above might not be as relevant – however on 3rd August we saw Elouise Fowler write in AFR ‘Low oil prices leave a slick on green electricity’. Within that article, Managing Director Matthew van der Linden is referenced when the article says:
“Flow Power, majority owned by Canadian pension fund OPTrust which has about $19 billion of assets under management, has clocked an 18 per cent drop in June revenue compared with June last year. June revenue fell 13 per cent compared with May.”
B1d) Todae Solar goes belly up
Whilst they were not a registered electricity retailer, they were involved in the supply chain and I did note this report on 3rd July in the Australian referencing an 80% sales drop in March and April 2020 due to the COVID pandemic.
B2) Musical chairs
It’s worth noting that the industry bodies have taken some steps to try to help manage the stresses (such as the AER’s Statement of Expectations on 27th March 2020), but some of these have been more focused on helping energy users and not participants in the supply chain. This report from ESC Victoria from 28th June also addresses some concerns.
In some ways it could be like watching a game of ‘musical chairs’ unfold if a significant number of energy users experience bill stress – waiting to see who ends up carrying the can. This was explored in the Australian on 28th July, and also in the AFR on the same day. Whilst we all love to hate the big bad retailers, there are also implications for smaller retailers that we need to be mindful of.
Back on 31st March, Cara Graham at EY suggested that we should brush up on the ‘Retailer of Last Resort’ provisions, as we might need to use them.
—
That’s all I have time for today…


Leave a comment