

Yesterday, Paul published these ‘Snippets from ‘Workshop 3’ (on 11th May 2026) with respect to the ST PASA Replacement Project’, and finished by noting the confluence of these 3 factors that have prompted us to prepare some updated analysis:
Factor #1) As noted above, we’re now ~10 months since unit-level ST PASA data went live;
Factor #2) The details provided in ST PASA workshop #3 prompted more thinking …
Factor #3) and it just so happens that a couple of us will be at the CEC Wind Industry Forum on Tuesday this week (26th May 2026).
As Paul noted, this reminded us of the analysis we’d performed previously and posted under the article ‘ ‘Is VRE forecastable? (Part 1 in what might be a series)’ on 27th February 2025.
Briefly, about the ST PASA Replacement Project
The Short Term Project Assessment of System Adequacy (ST PASA) process is being replaced. Modelling will be done at a nodal scale, employing a full network model. And that means each generator’s availability will be included explicitly.
The uncertainty of the availability forecasts used as input into the new PASA process will be included in the form of a dynamic “uncertainty margin”.
For variable renewable resources (VRE) – wind being the focus of this article – availability is weather dependent and hence uncertain in the future.
In the recent STPASA replacement project workshop we learned about this uncertainty margin and reflected on how VRE forecast uncertainty has been increasing over time.
With wind, the AEMO slides indicated NEM wind generation uncertainty can, at times, reach over 1 GW.
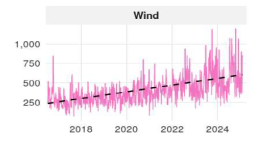
Wind uncertainty has grown over time. AEMO STPASA Replacement Workshop #3, May 2026.
Naturally the main driver of this increase in uncertainty would be linked to increasing generating capacity. The wind generation capacity for the NEM is reaching almost to 15 GW nowadays. With more wind capacity anticipated in the future aggregate uncertainty will grow in tandem.
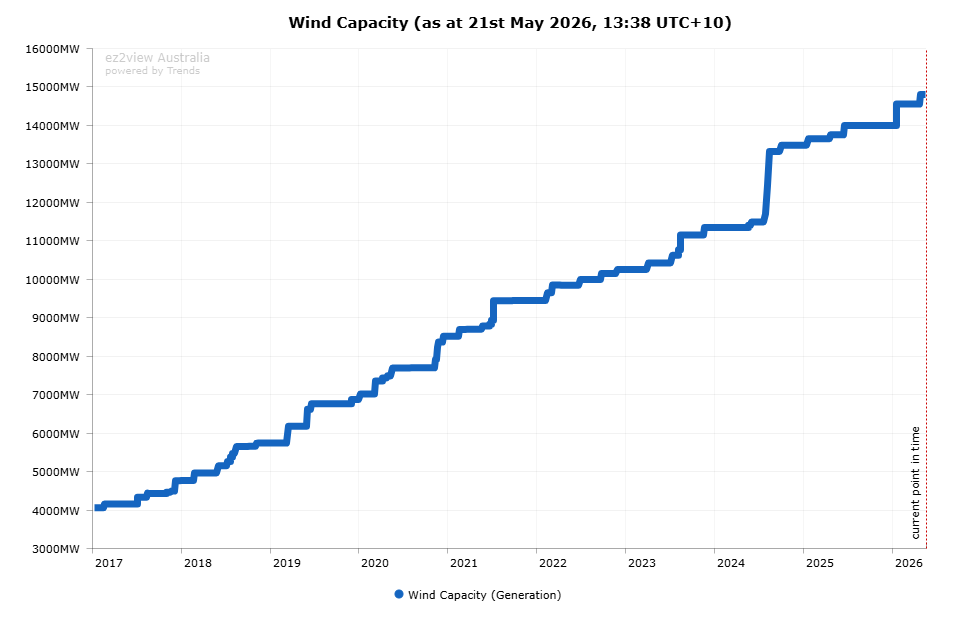
NEM Wind capacity
In subsequent follow ups with AEMO we gathered a better understanding of the approach to calculating uncertainty. The approach used for the workshop charts (above) selected the 95th percentile of forecast errors in 1-week rolling windows. The 24-hours ahead forecasts were used.
This inspired us to perform our own analysis on the uncertainty of wind availability forecasts.
Of course, we’ve done this in the past. For the GenInsights21 analytical report, we investigated how the uncertainty has changed over time with a similar approach, finding both:
- that it has increased,
- yet relative to capacity uncertainty had reduced and begun to plateau.
However, that analysis used predispatch forecasts, assessing out 24 hours only.
Orientation with the ST PASA outlook
ST PASA, as defined in NER 3.7.3, requires AEMO to cover each 30-minute period in the seven trading days from and including the day of publication. AEMO meets this requirement by determining and publishing pre-dispatch PASA (PD PASA) and 6-day PASA; from the end of the next trading day.
This longer PASA outlook happens to be the one published as ST PASA in AEMO datasets. The near-term timeframe is met by the PD PASA datasets.
By way of example, the next chart shows Victorian (VIC) actuals (30-minute averages) and the PASA forecast availability which we’ve labelled STPASA VIC UIGF. In Vic capacity is 5,918 MW nowadays.
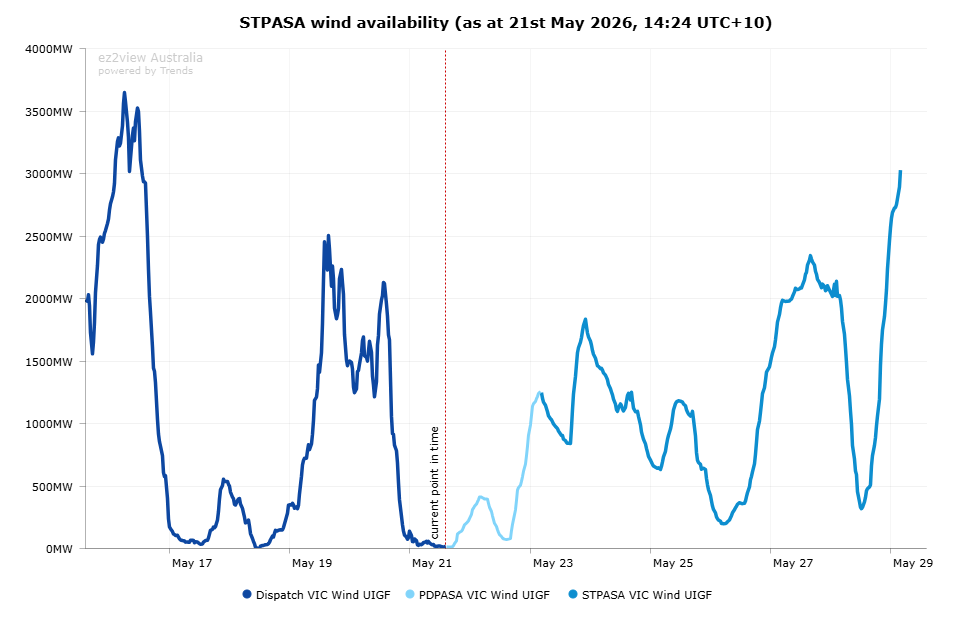
VIC wind availability in the ST horizon
The gap (between actual and ST PASA outlook) is met by PD PASA, apparent in the light blue. The ST PASA set extends past 6 days.
Looking at our VIC example, above:
- actual availability at 14:30 on Thursday 21st May 2026 was near zero. A wind lull!
- And, of course, we can also see the low availability of Victorian wind throughout the days on Sunday 17th May and Monday 18th May (with the Monday lull being particularly pronounced for VRE all the way across the NEM).
The next chart:
- Represents, in conjunction with the above, a form of ‘forecast convergence’ analysis.
- It shows the forecast that was made 6 days prior.
With respect to the chart below:
- For the period highlighted on (i.e. 14:30 on Thursday 21st May … 6 days hence) we calculate the Forecast ‘Error’ (forecast – actual) as approximately +890 MW. We use this to illustrate the evaluation of a 6-day ahead forecast.
- As an aside, note that the forecast for Sunday 17th May and Monday 18th May (not as far in advance) was that the yield would be low.
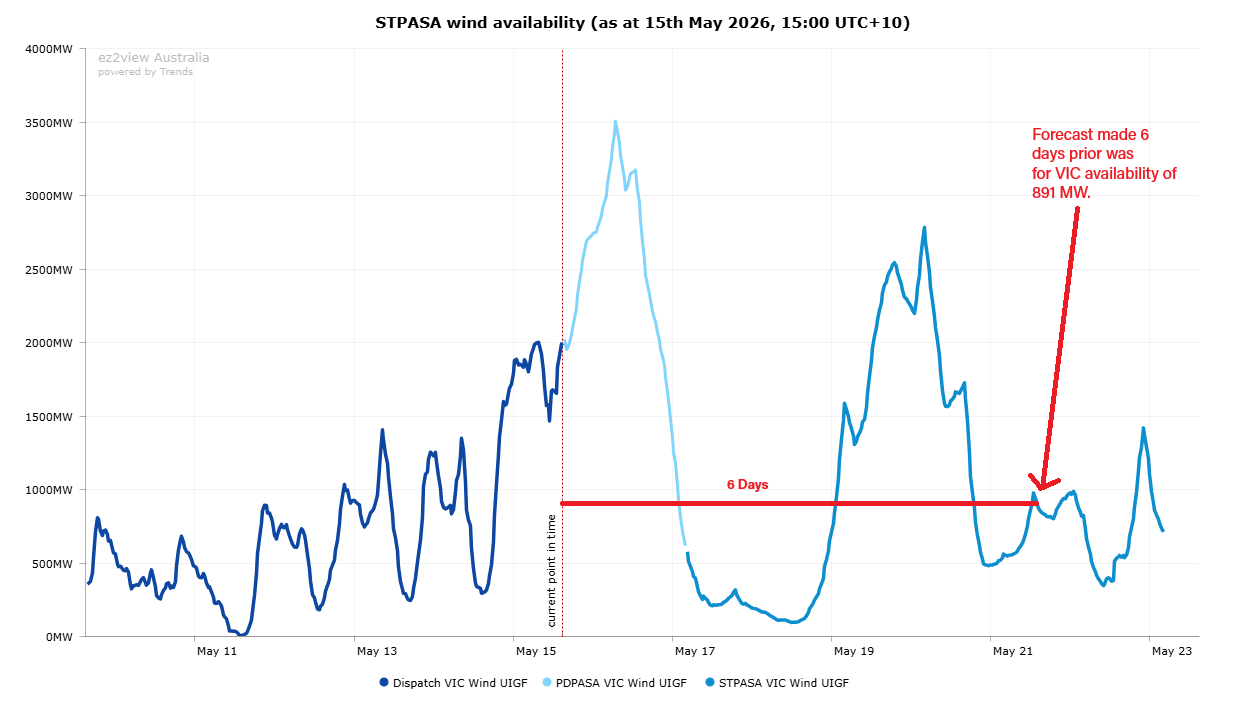
Branching from this basis, we perform the same analysis at the unit-level.
Introducing PASA DUID availability
On 31 July 2025, AEMO started publishing unit-level availability information for the ST PASA timeframe.
We noted this on the go-live date. This was significant because, until then, unit-level outlooks for Wind availability were published only into the predispatch timeframe (for predispatch), not for the full 7-day ST timeframe. Only the region-level aggregates (as pictured above for Victoria) were published into the ST timeframe.
Given:
- Unit-level availabilities now extend out 7 days, and
- The future PASA system will model individual generators
we can turn our thinking to supply-side uncertainty in this timeframe, at the unit level.
Assessing uncertainty of the 6-day ahead forecasts
For the PASA process, the upper-end errors are used to quantify uncertainty because the process needs to be conservative about supply being lower than anticipated. Selecting the 95th percentile error from a set catches a measure of overestimation uncertainty
We take a similar approach here. To reduce datapoints, and noise, we summarise the errors from these forecasts, made at hourly intervals, into rolling 7-day windows that shift by day. We take the 95th percentile of the errors. This aims to approximate the approach that AEMO took with the NEM wind analysis pictured earlier.
The uncertainties (95th percentiles of the rolling 7-da windows) indicate the level of overestimation in the forecast that would be seen in 1 in 20 forecasts. In a 7-day period, with forecasts issued hourly, there are 168 datapoints for any given window. The 95th percentile aligns with the 8th highest.
Rye Park wind farm, by way of example, shows distinct cycles of higher, then lower, uncertainty.
These cycles are suspected to be weather related – passages of good certainty in winds appear among periods of higher uncertainty that may be related to weather-regime changes that impart increased uncertainty in winds.
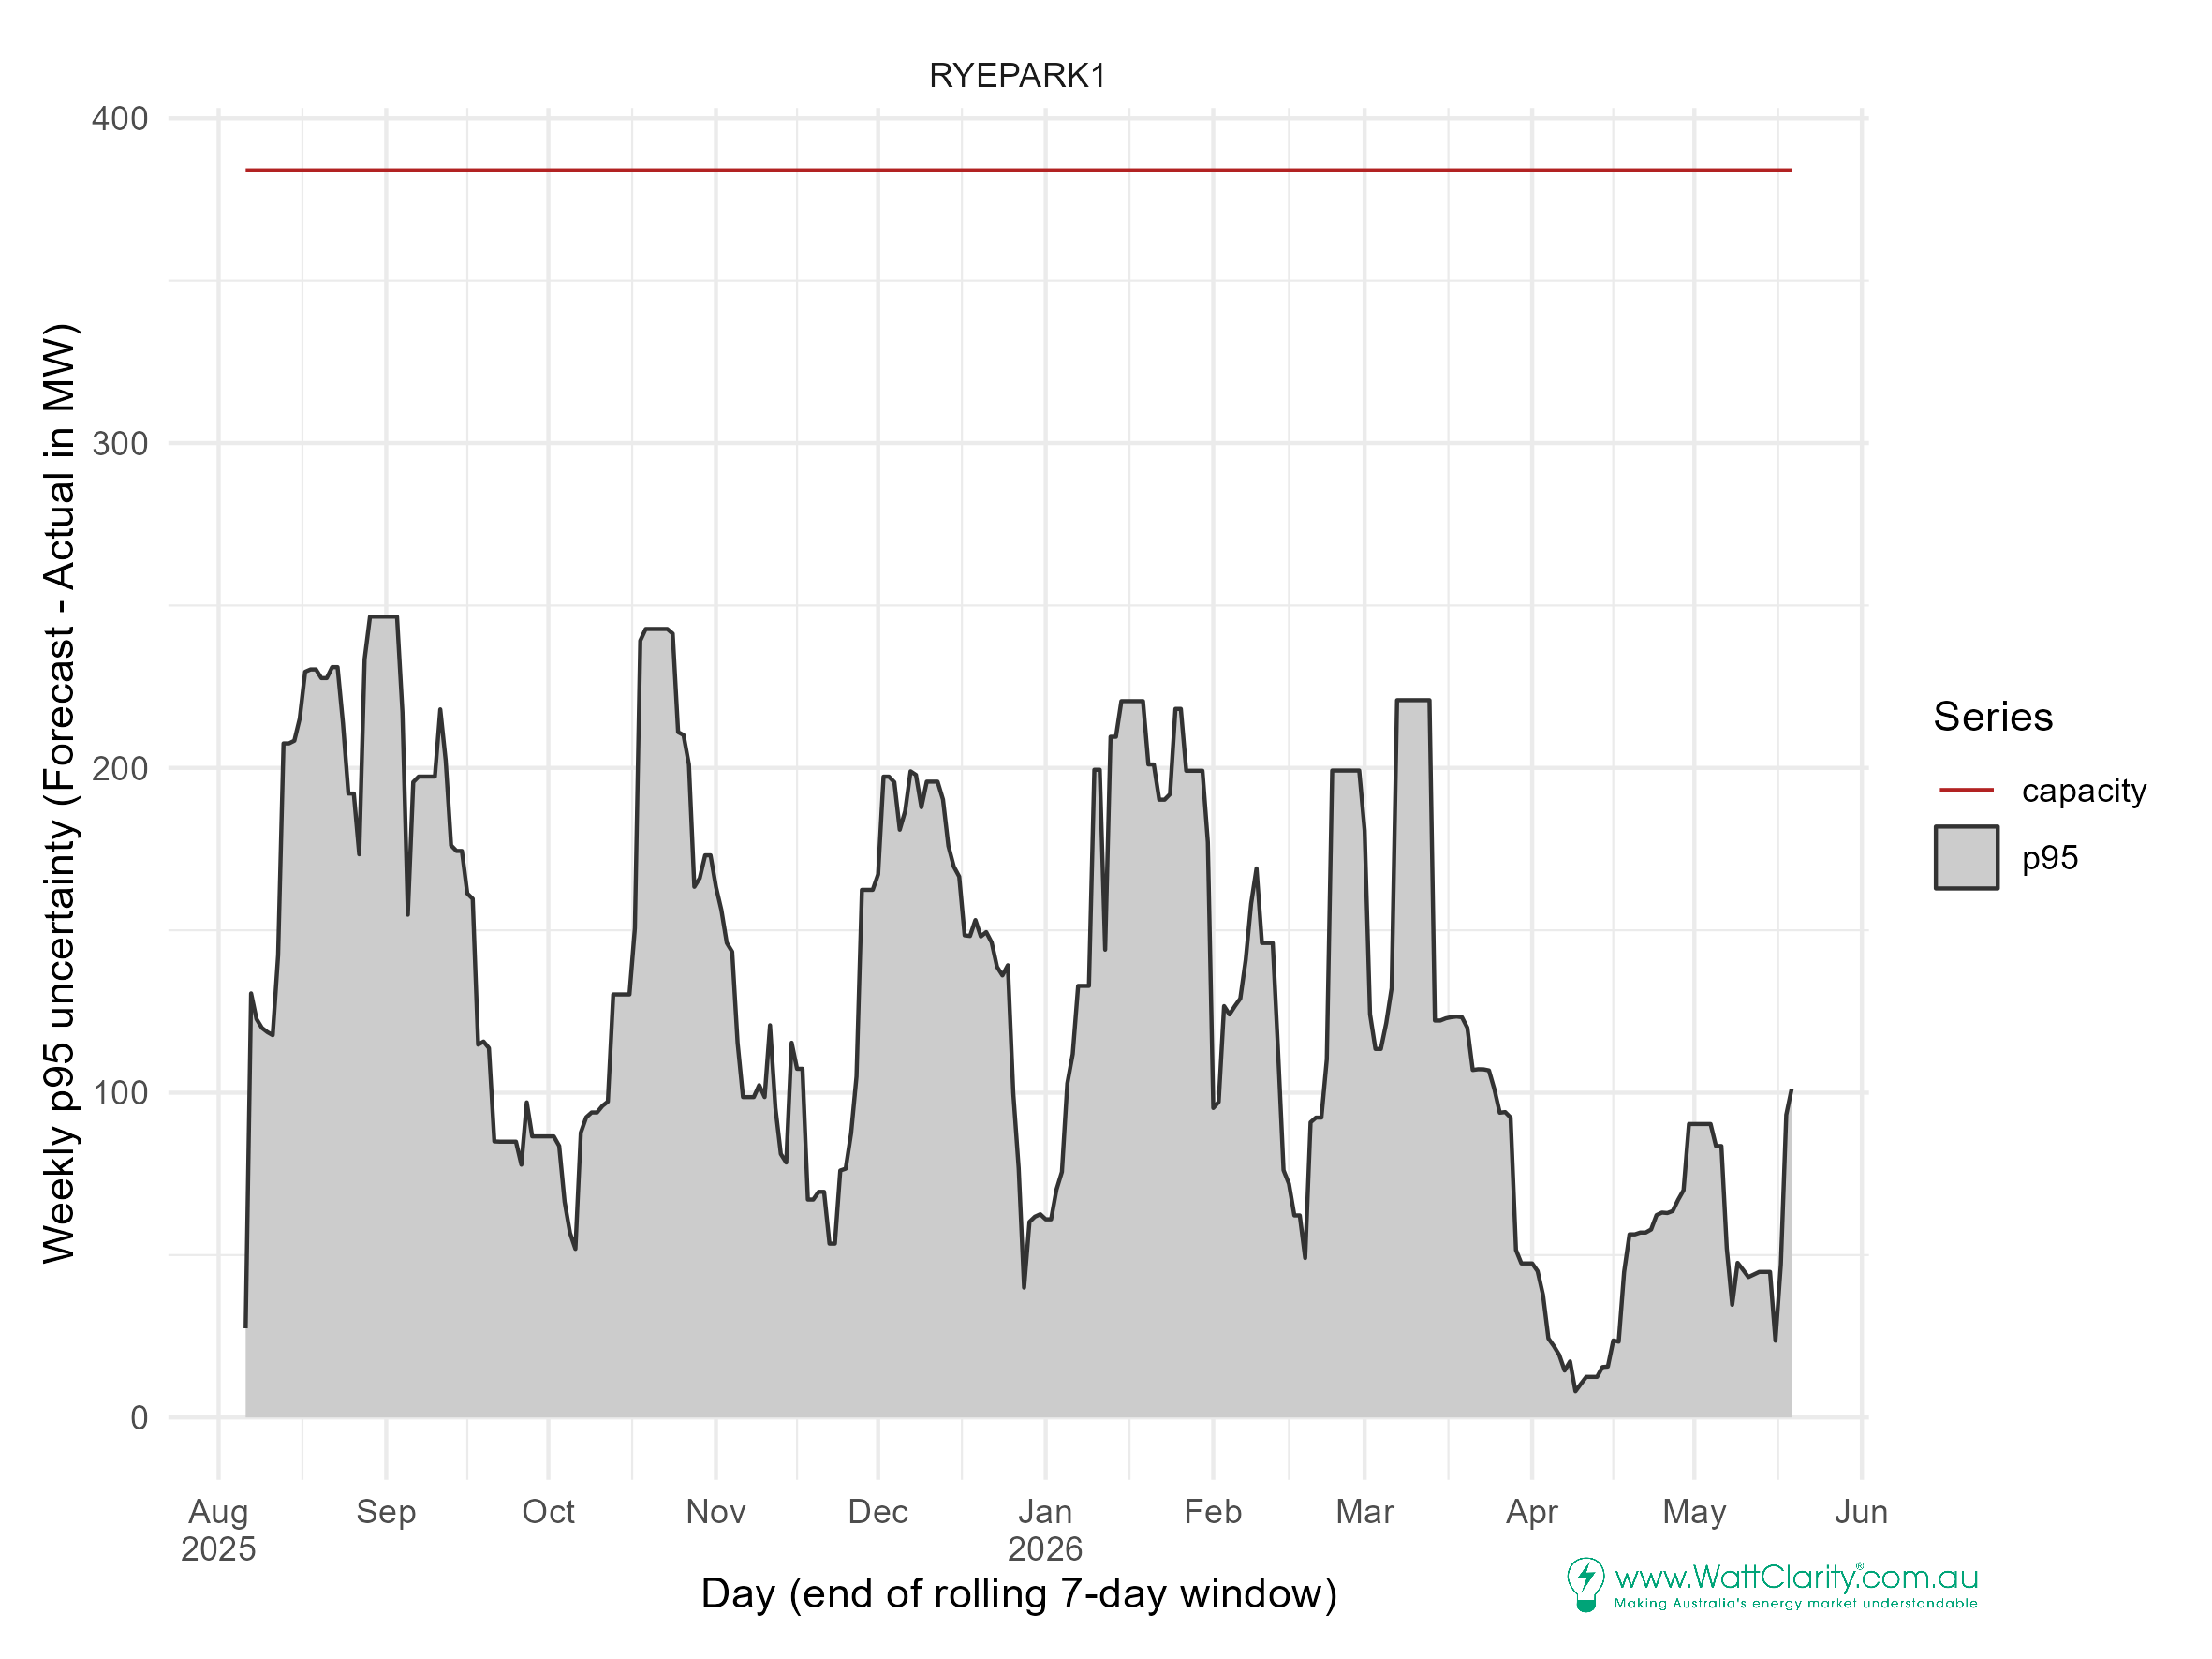
At times these uncertainty levels are found to reach more than half of the unit’s max capacity. At other times, the levels drop below 50 MW which would be closer to a factor of 0.12.
Uncertainties appear correlated between some units… sometimes
When we compare uncertainties among wind farms, similarities in patterns are detected.
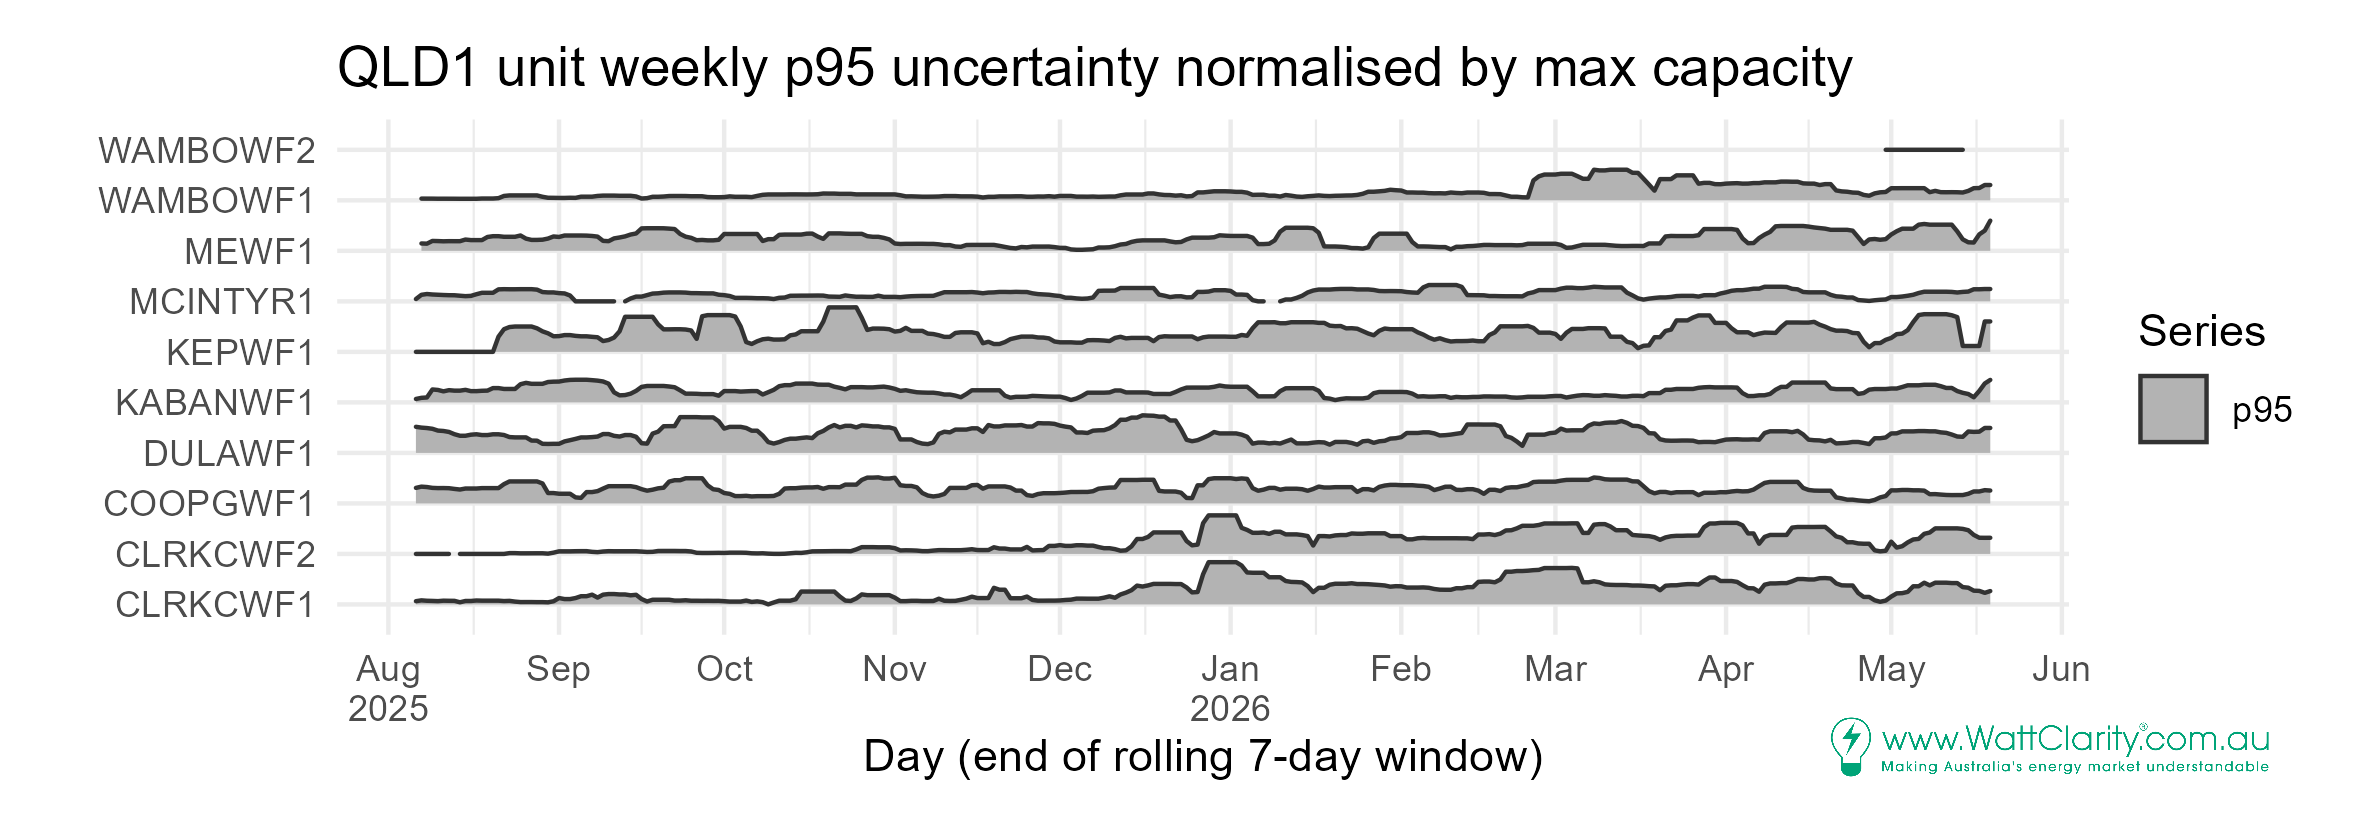
In QLD, there isn’t too much commonality. Units sited nearby, such as Clarke Creek (units CLRKCWF1 and CLRKCWF2), are obviously influenced by the same weather and therefore have very similar uncertainty.
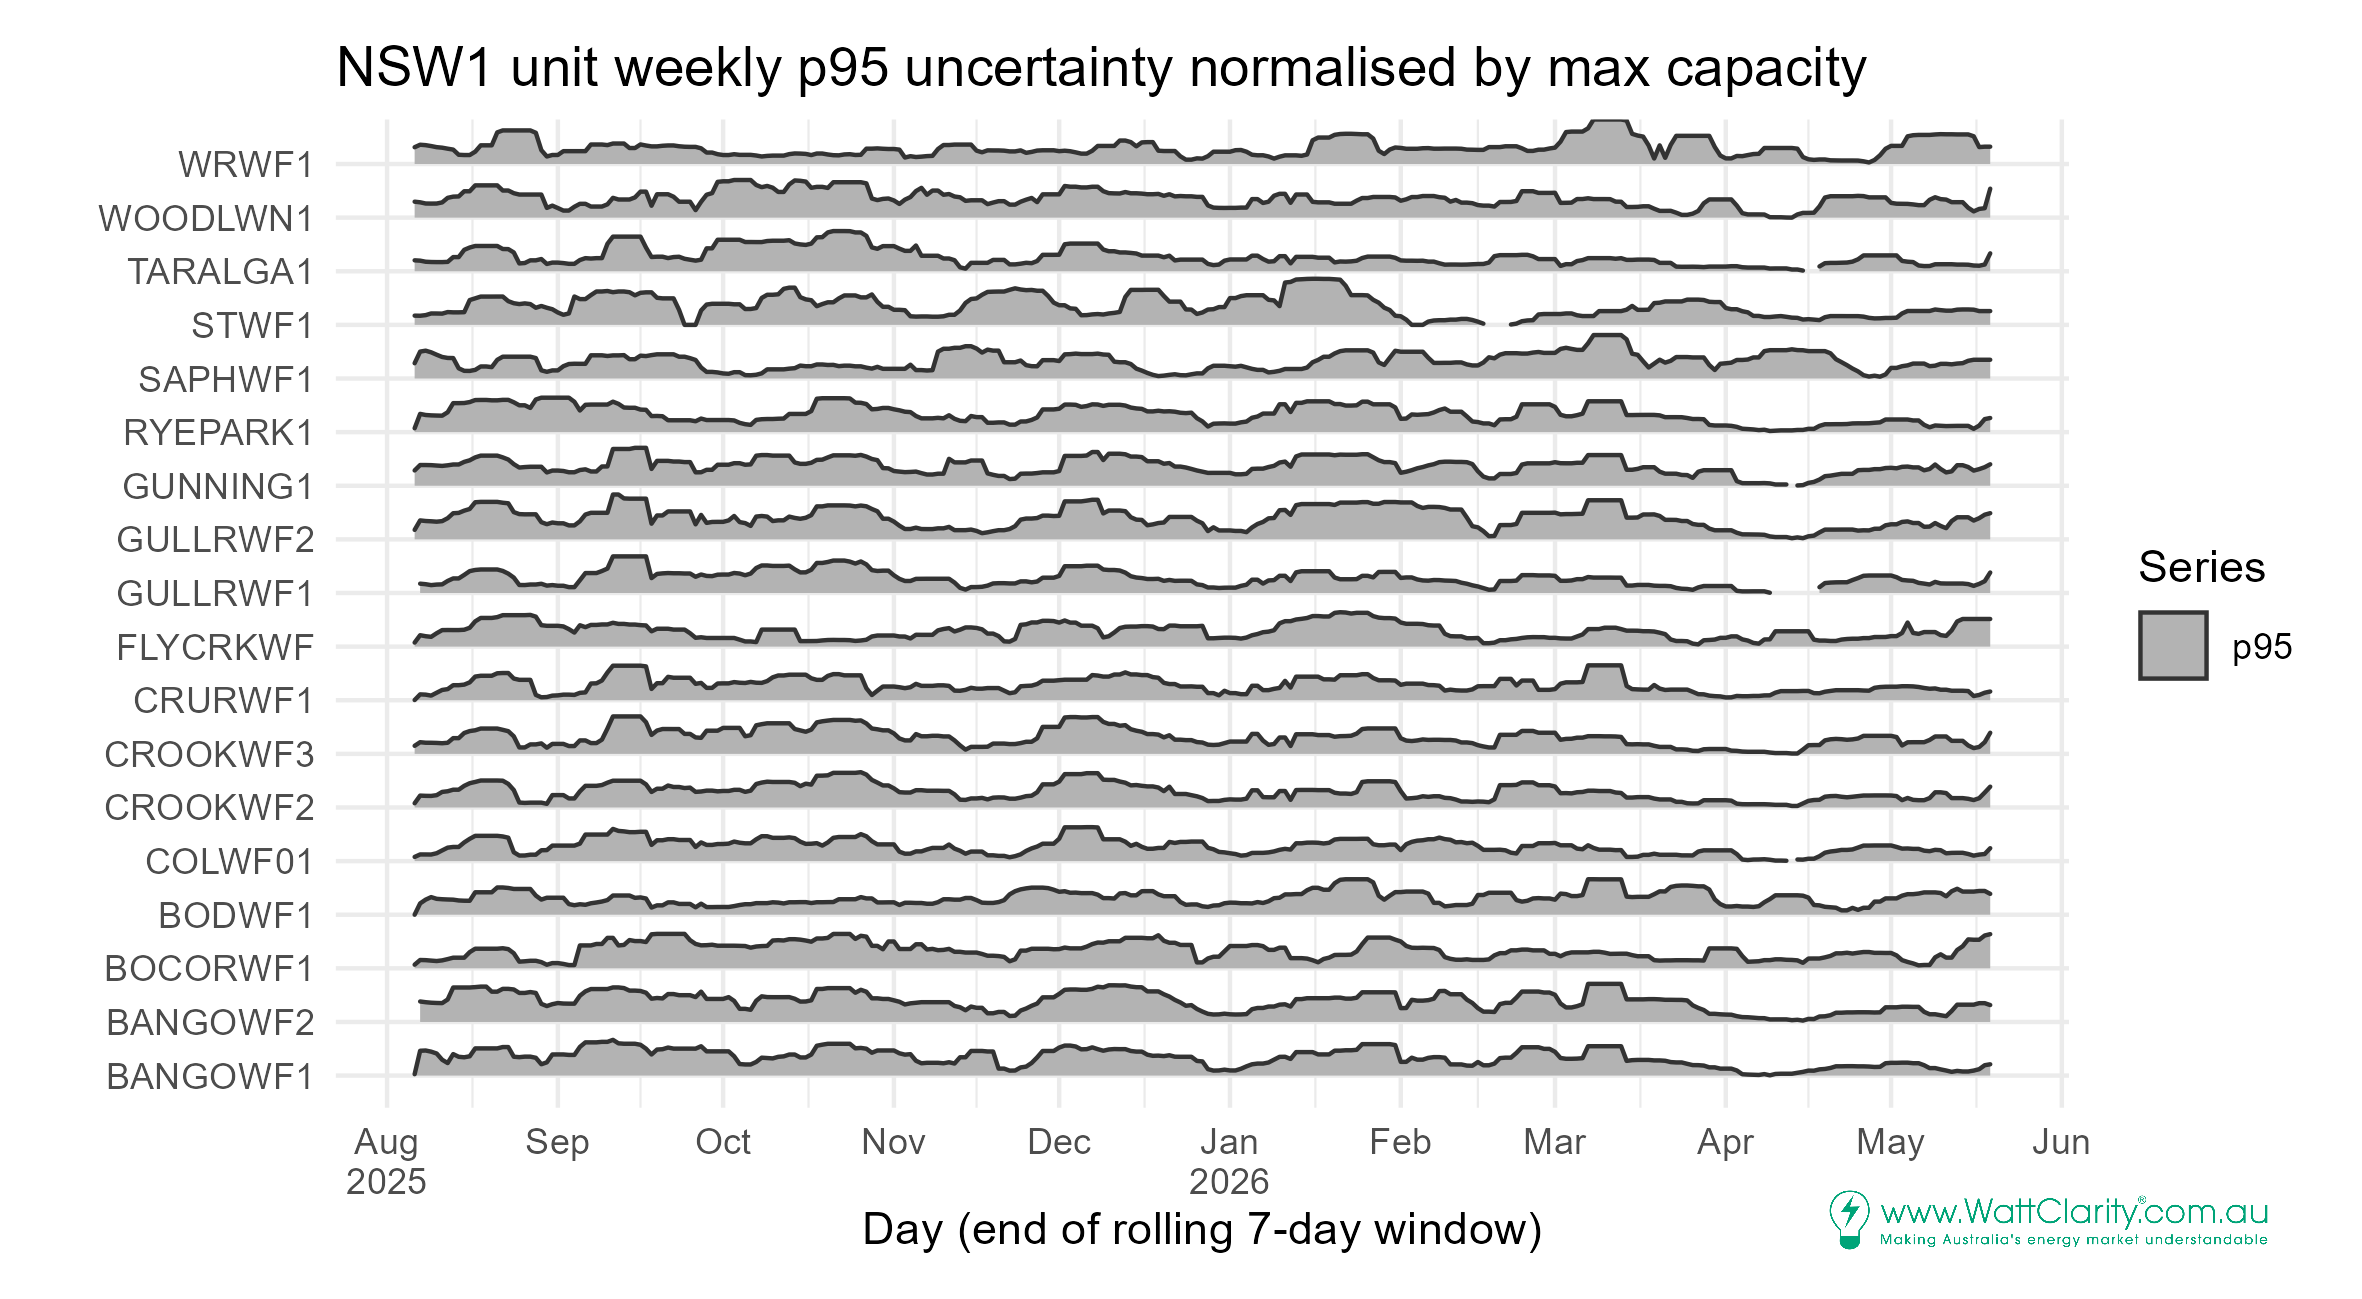
In NSW, there is some commonality in the patterns. A period of low uncertainty in late-December / early-January is seen at many units, with increased uncertainty either side.
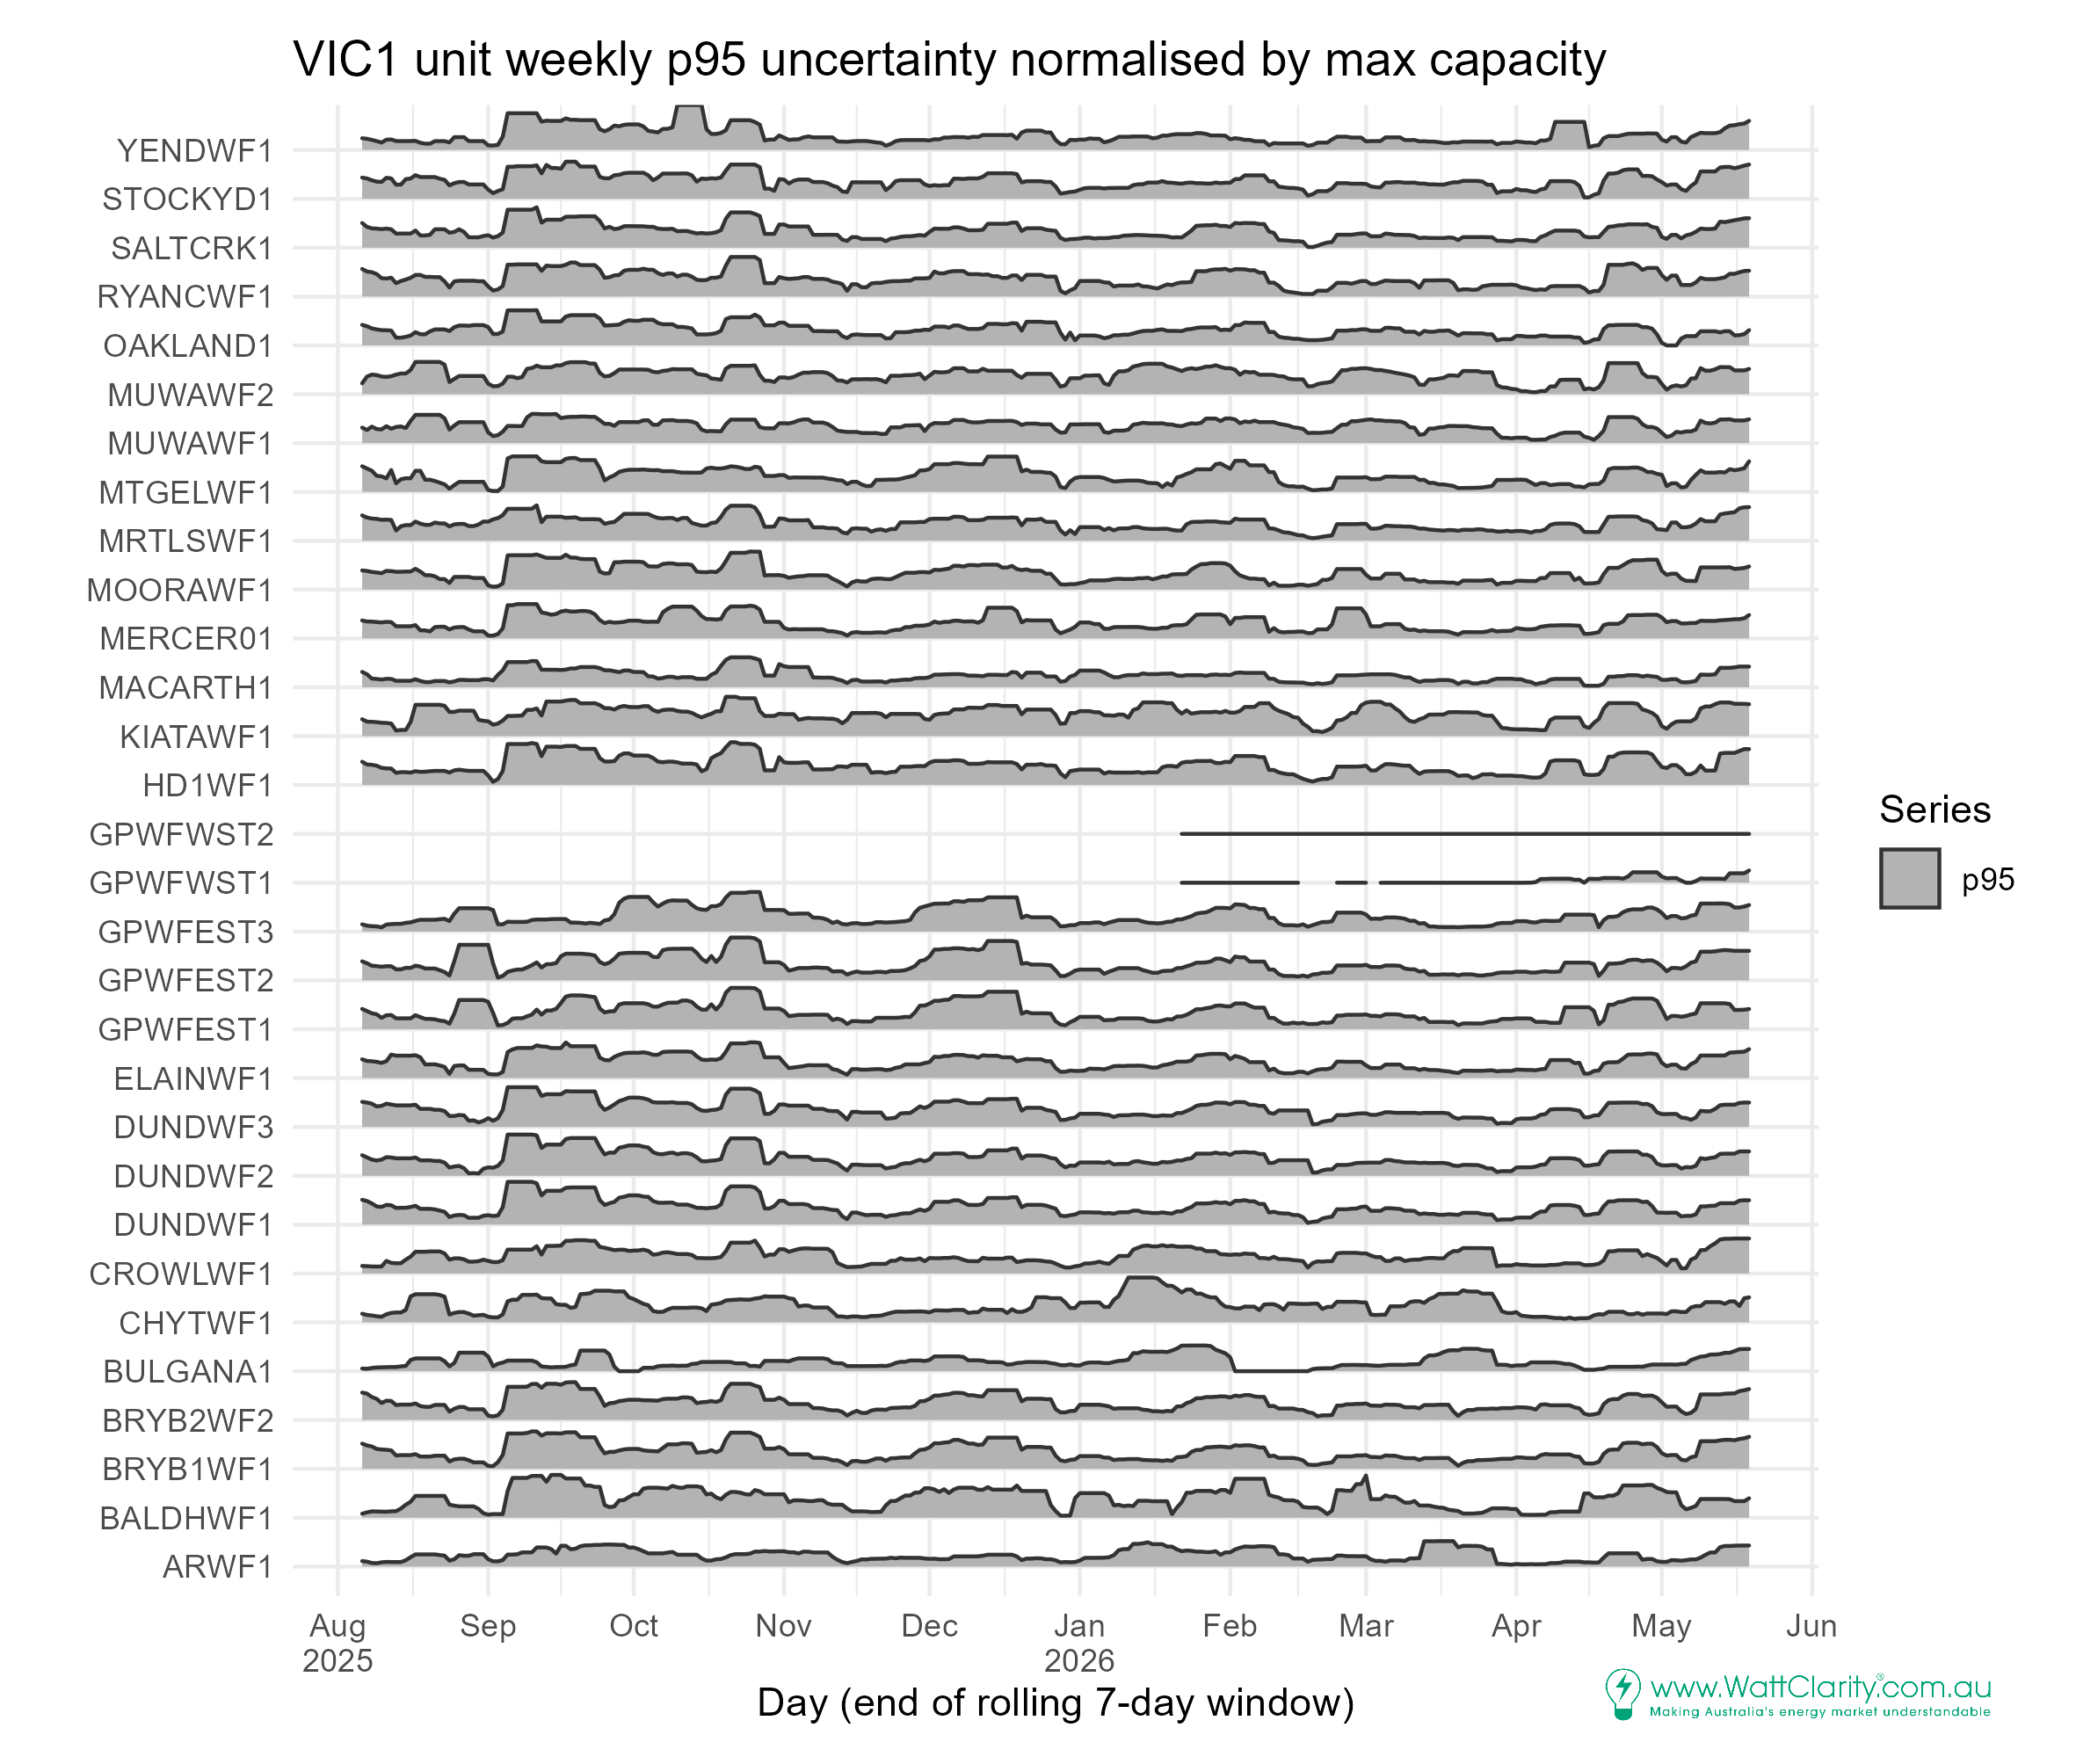
In VIC, unit-level uncertainties appear to be closely correlated for many units. The timing of peaks and dips is frequently common among units.
In SA, the first half of September stands out as a period of collective higher uncertainty. But the time October came around that uncertainty had improved for most units.
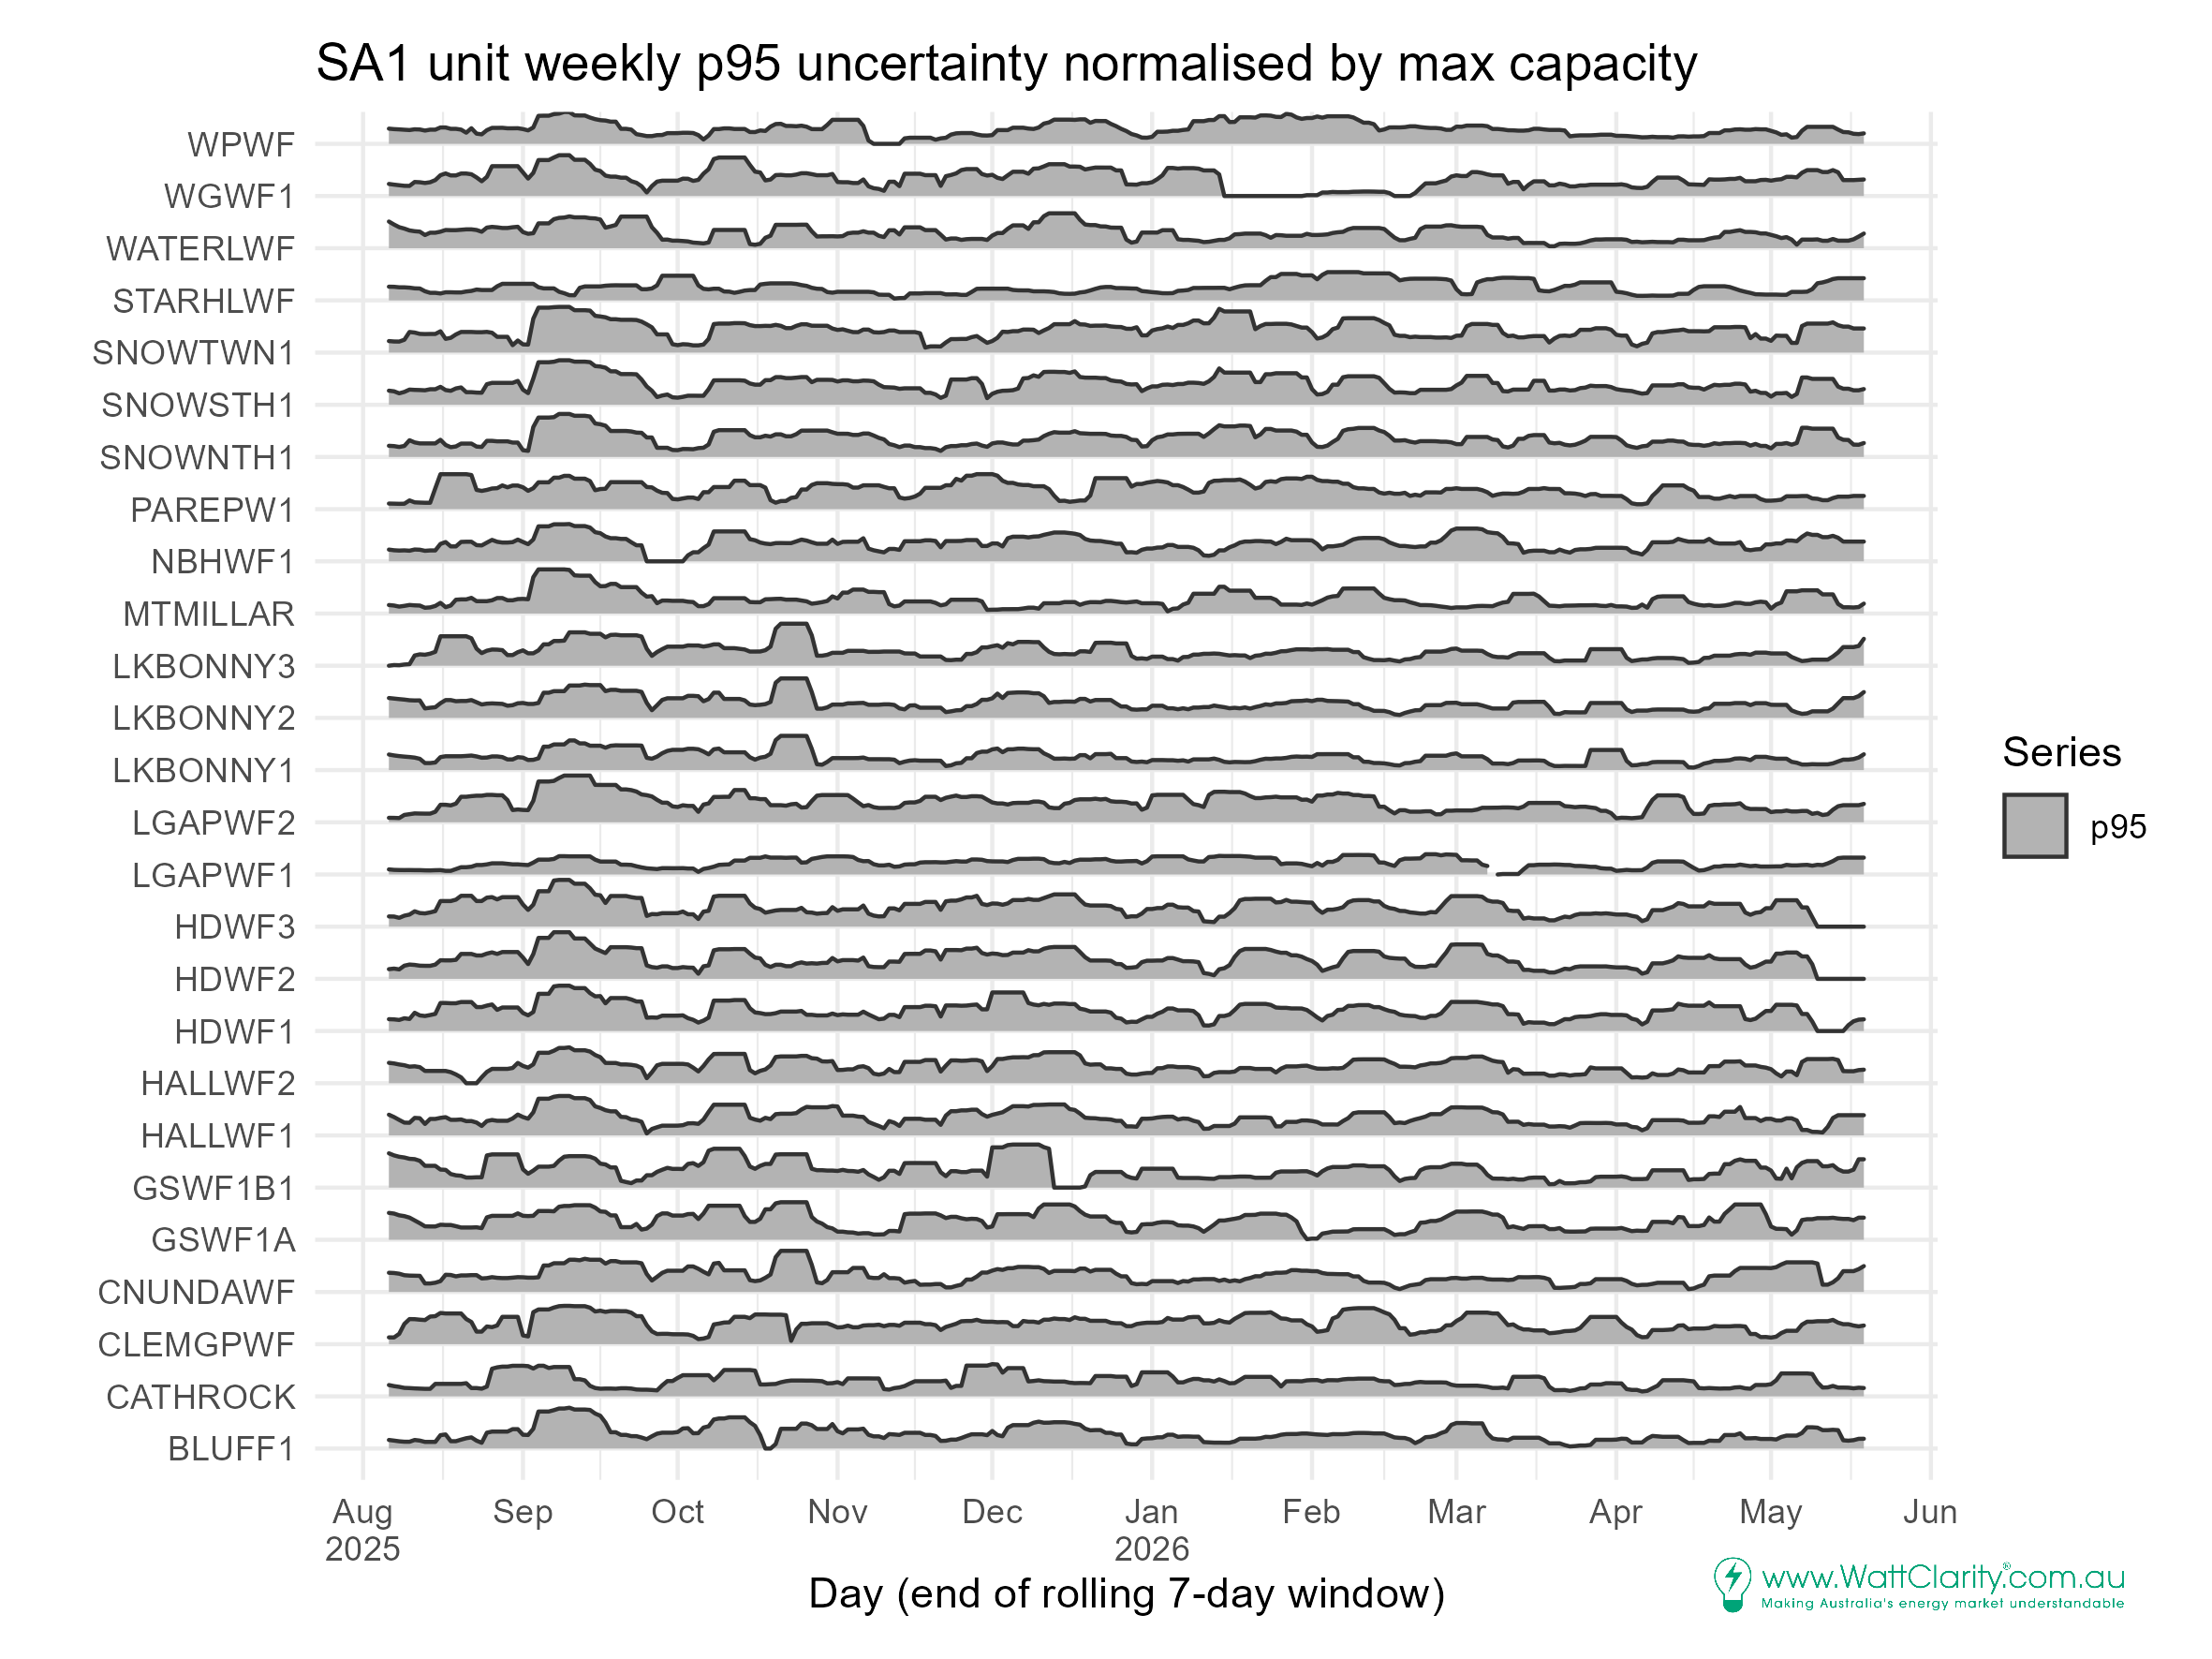
And not forgetting TAS, where three semi-scheduled wind units are operating.

So how much does geographical location play a role?
In the next chart we plot the mean uncertainties geographically. Note that the locations are approximate. Some points are nudged to avoid overlaps for chart visibility. 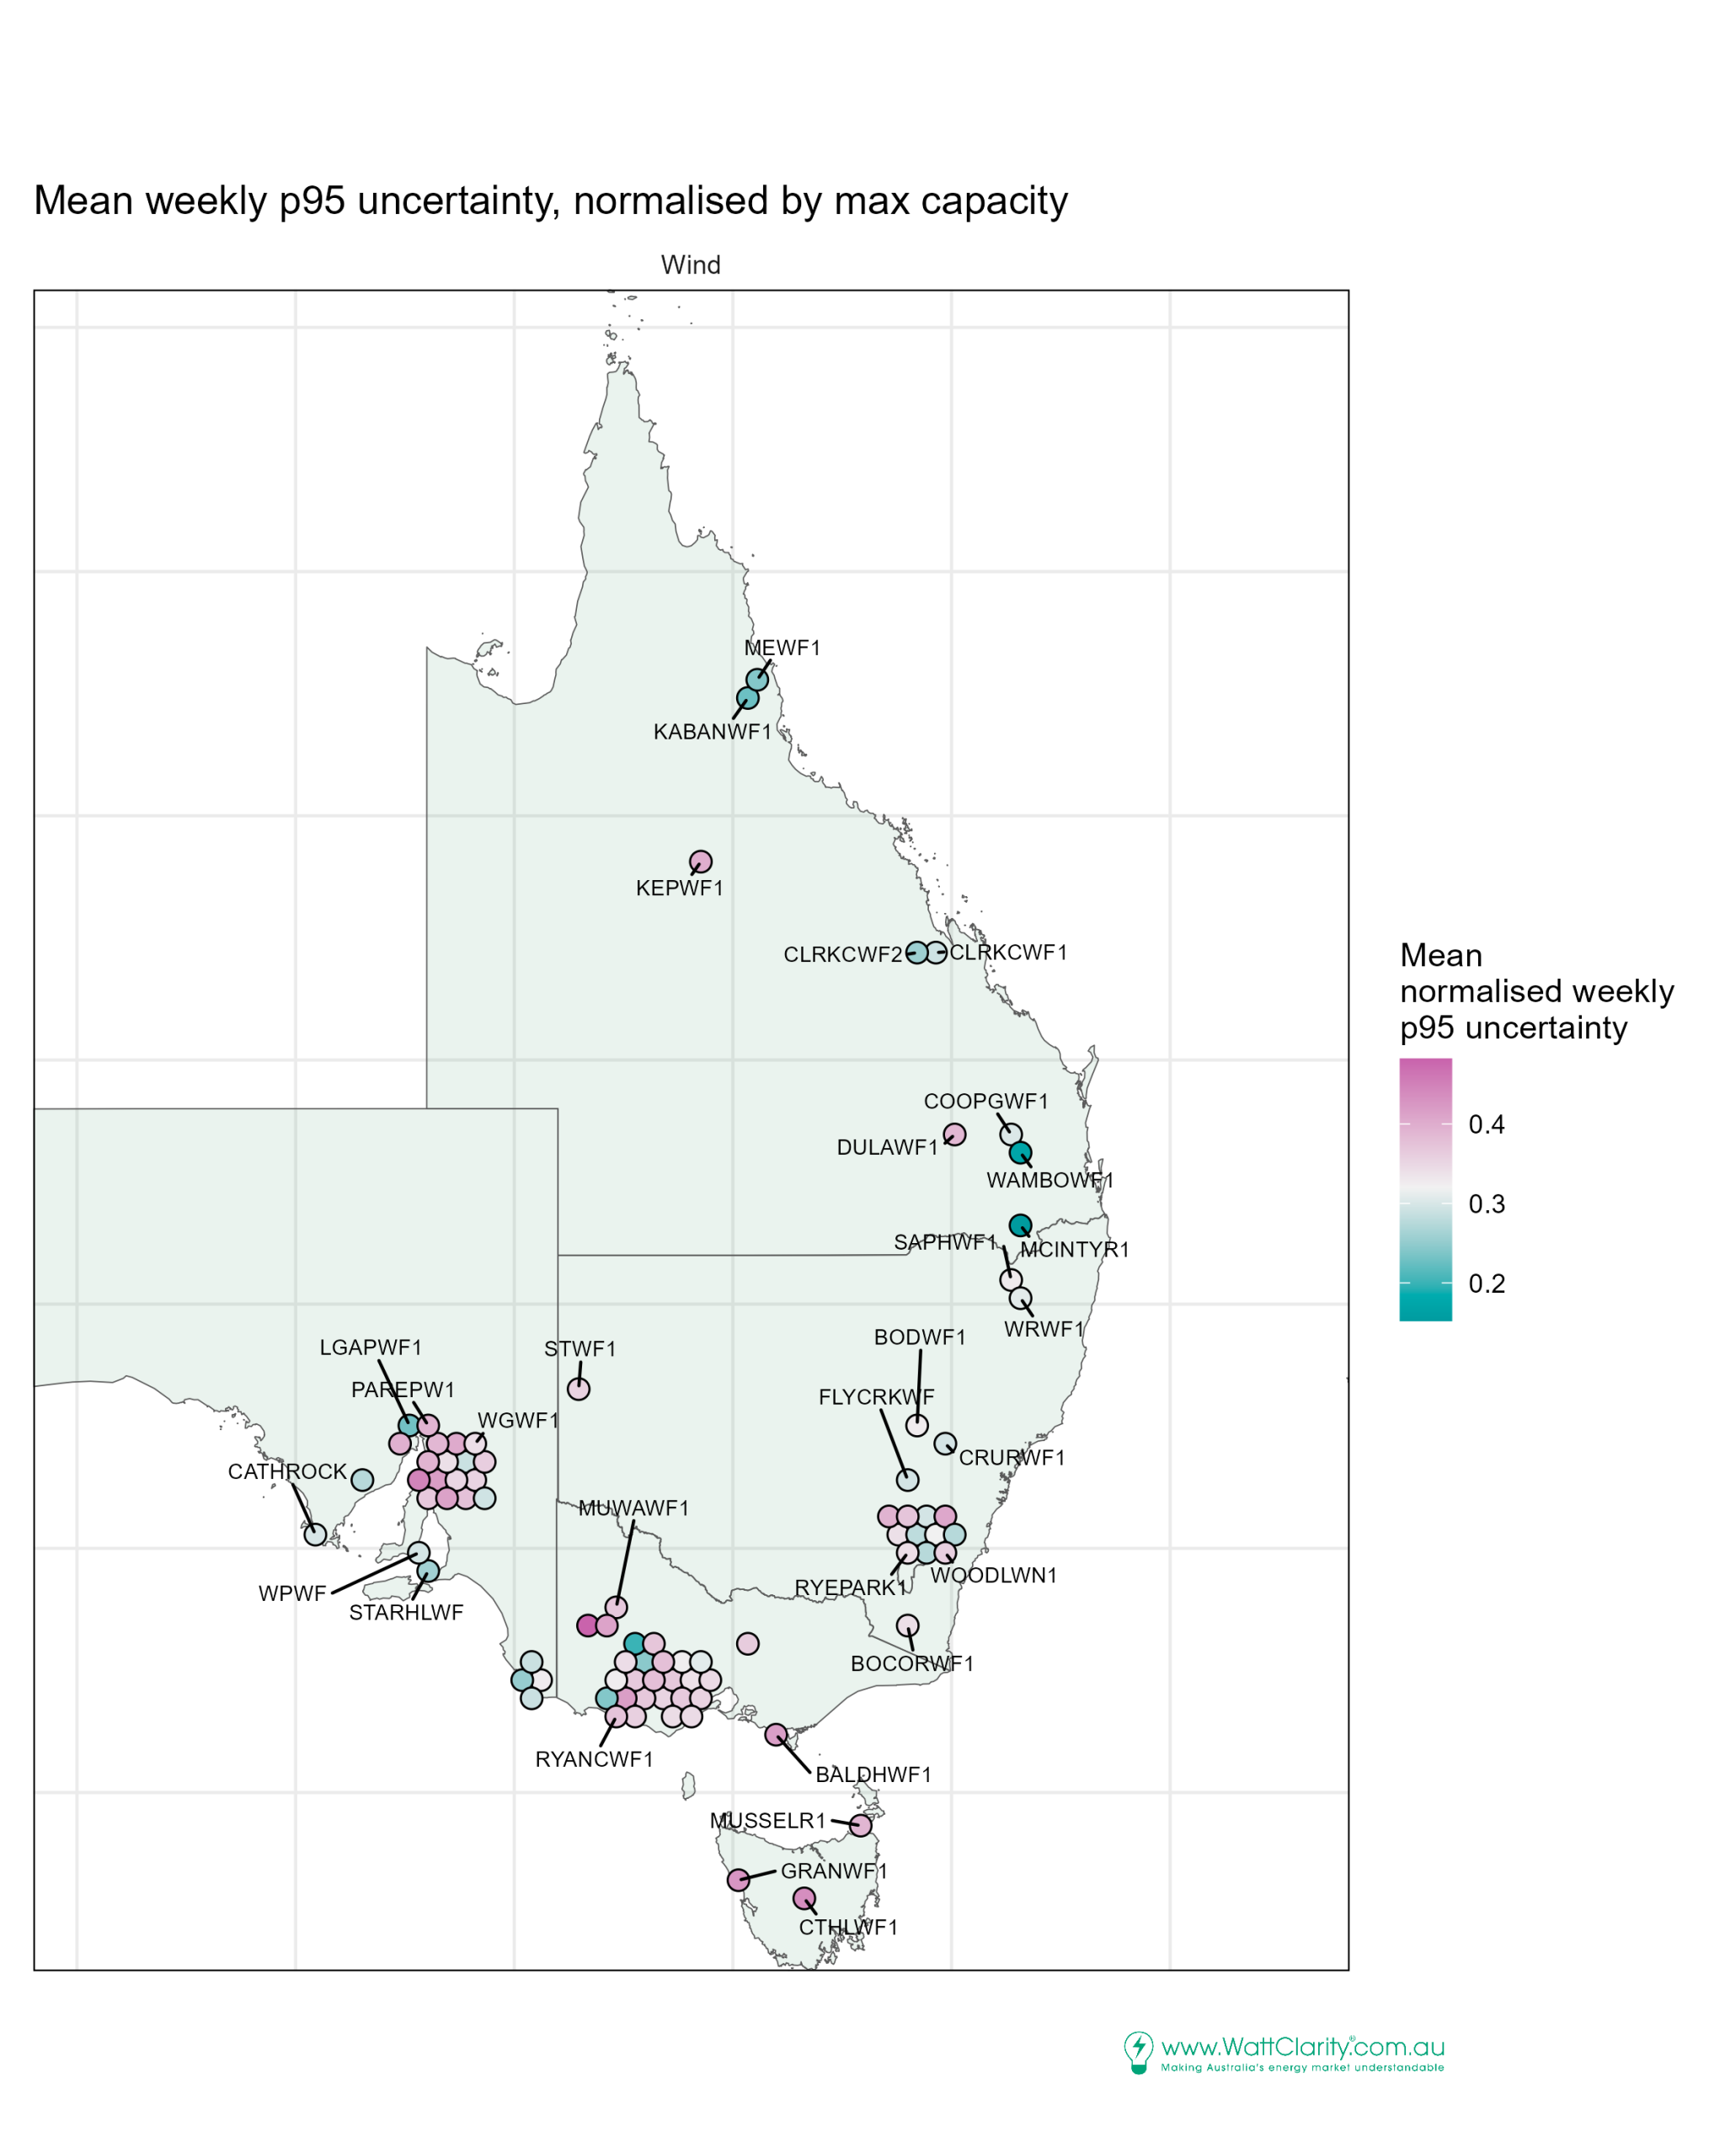
Queensland uncertainties are lowest overall. Queensland units closer to the coast appear to have lower uncertainty, relative to units further inland, and to the other units of the NEM.
In SA the units closest to the southern coastline have lower uncertainties than the units around the cluster of units in the mid-north.
How does Capacity Size play a role?
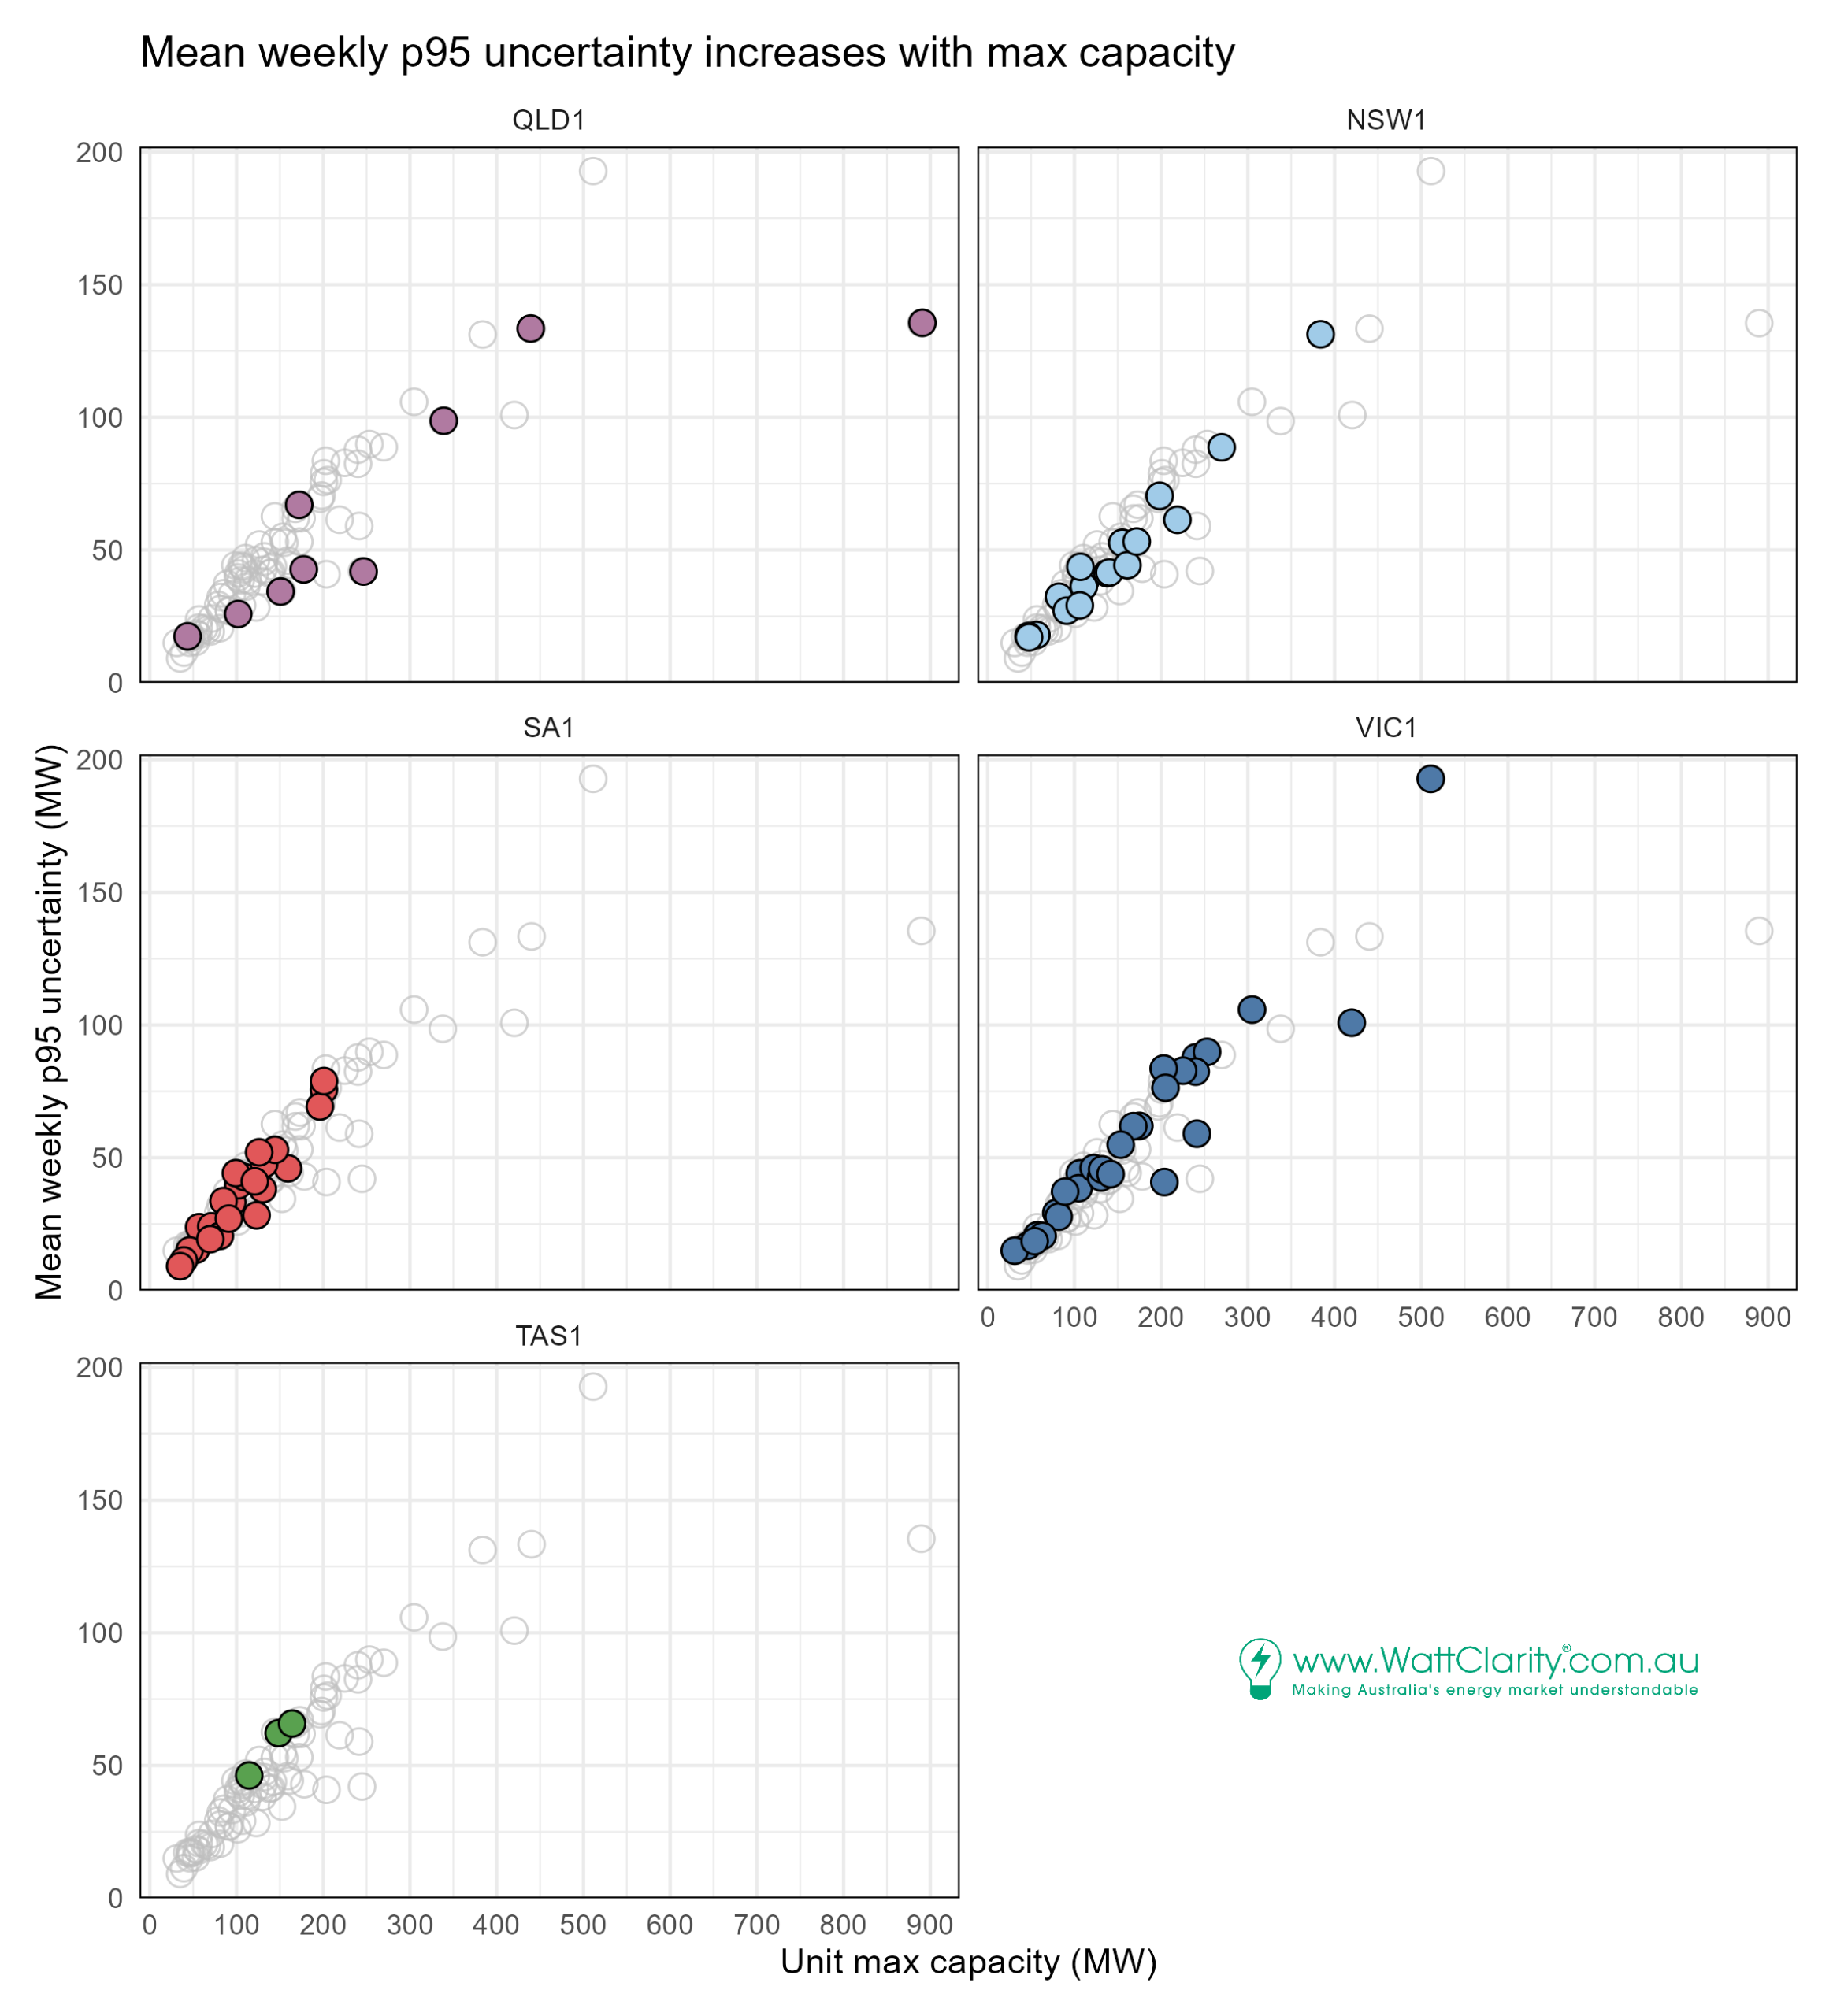
As you would expect, we find that the uncertainty does linearly increase with unit capacity.
Comparing across 84 individual Wind Farms
Taking one final step back to inspect relative differences among units, the next chart identifies:
- Kiata WF as the most uncertain, and
- MacIntyre WF as the least uncertain
… when normalised by installed capacity.
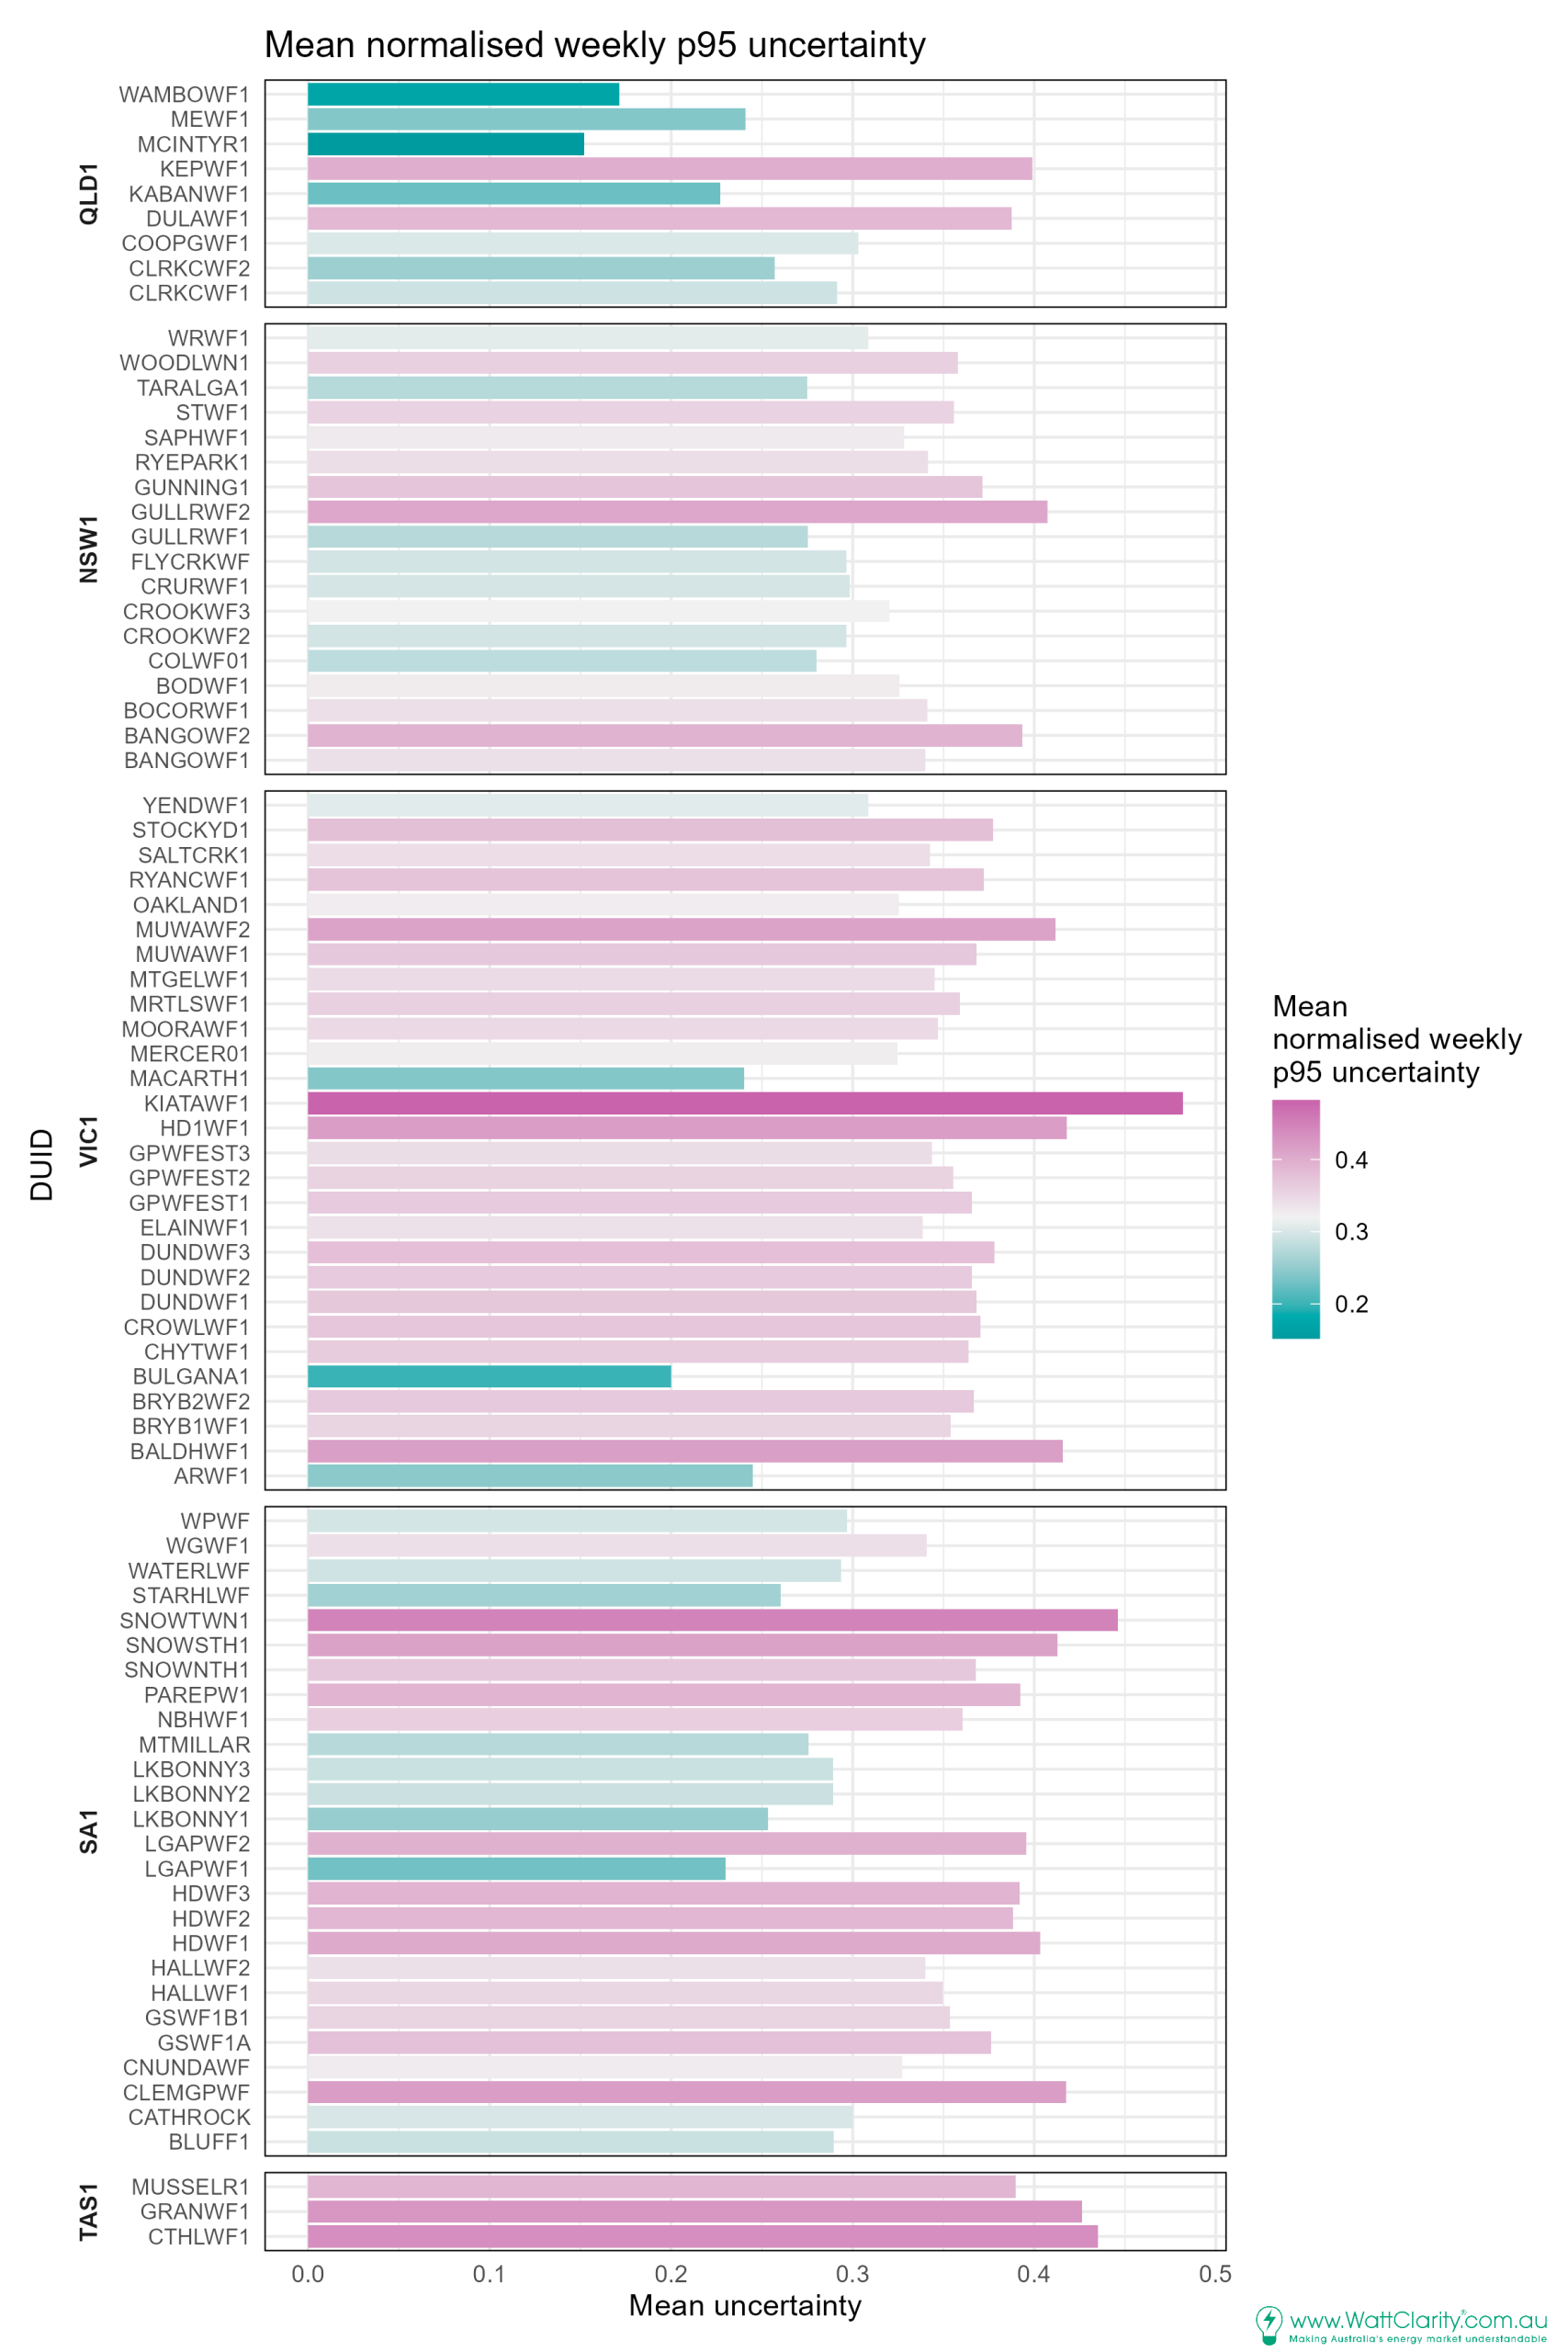 We excluded Wambo2 WF and Golden Plains West 1&2 as in commissioning.
Conclusions
We assessed the 6-day ahead forecasts used for wind farm unit-level availability.
The measure of uncertainty captured the potential for overestimation in the forecasts. Possible overestimation in availability forecasts leads to less-than-anticipated availability for dispatch, critical for system adequacy.
We’ve found this measure of uncertainty fluctuates considerably in the 6-day ahead forecasts. Some locations, appear to be generally more predictable than others, Queensland sites in particular.
In the southern regions there is visible commonality in uncertainty among wind farms. Weather patterns imparting greater uncertainty tend to impact many sites at the same time.
Future directions
Future directions might include assessing the full range of the outlook period. Another is evaluating underestimation uncertainty alongside the overestimation uncertainty that we studied here, for differences at that low end.

My experience is weather forecasts are useless beyond 4 days ahead. Can you do an analysis that looks at RMS error in estimate vs days ahead. I suspect you’ll see 3 days ahead is where it gets fairly reliable.
For a grid without coal, 48hrs accuracy is really all you need. Running 2GW of gas for 48hrs is a lot better than 10GW for 10hrs.
Good points Mark. We also need to keep in mind that weather-driven uncertainty in demand likely exhibits relatively rapid growth beyond the same 3-4 day horizon too. With an energy-constrained supply side it’s going to be those first 3-4 days in the projection that are most important for reliability over the succeeding days anyway.
What will be interesting is whether the current spot market mechanism will be enough to bring the gas turbines online early. The batteries should foresee the VRE shortage and withold capacity in hopes of cashing in on the price spike. That should increase the spot price, but will it bring gas turbines in early enough? 48hrs @ $400/MWh is cheaper than 1hr @ $23,200/MWh