Two things popped into my head in quick succession earlier this morning when I saw the AEMO forecasts for LOR3 (i.e. load shedding) in NSW for this coming Monday 16th December 2024:
1) As noted in the article ‘Surely not again so soon?! …. AEMO forecasts LOR3 (i.e. load shedding) for NSW on Monday 16th December 2024’, I said as I did a double-take over breakfast.
2) My second thought was that the purpose of these forecasts is to elicit a market response … so here’s hoping that one turns up soon, to avoid the need of AEMO (again) incurring, on behalf of energy users, the additional expense of Reserve Trader.
In this article we’ll take a first look at what we can see in the market data, using our ez2view market insights software application:
… CAVEAT = done quickly, may be mistakes!
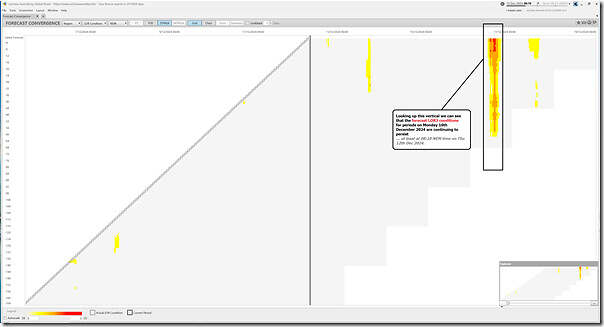
(A) Are the (concerning) forecasts still there?
The Market Notice we referenced here was published at 00:42 (NEM time) this morning, so it’s reasonable to firstly wonder if these forecasts have persisted over the ~8 hours since that time to the writing of this article.
With the ‘Forecast Convergence’ widget in ez2view we can easily see that YES, these forecast load shedding conditions do persist – this snapshot taken at the 08:10 dispatch interval (NEM time) this morning:
Remember to click on an image for a larger view … and also that you can use this widget to
(B) A high-level supply-demand balance
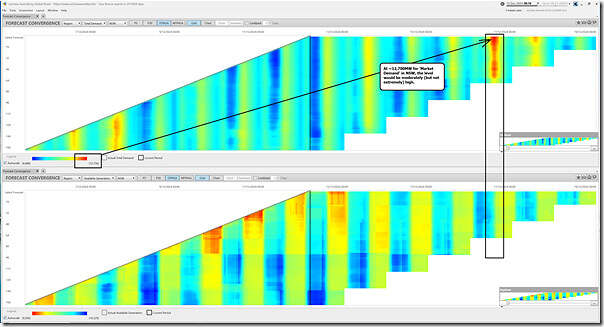
Using two copies of the ‘Forecast Convergence’ widget in ez2view we then see one of the drivers to the ‘why on Monday?’ question is the relatively high demand forecast for NSW:
Looking at the top chart the two key take-aways for readers to understand are:
1) Demand forecasts are such that the ‘Market Demand’ level might be ~12,700MW, which:
(a) Is obviously higher than the demand for any other day in that 14-day period shown;
(b) So is moderately (but not extremely*) high
i. * on measured on the same basis, the all-time maximum was 14,649MW some years ago
… so Monday might be ~2,000MW below the all-time maximum
ii. however another useful reference is that a demand level of 12,700MW:
1. would be considerably higher than what was actually seen on 27th November 2024 …
2. Which in and of itself was considerably higher than the 28 days to 26th November, as Dan illustrated here
2) The second key point is that the colour of demand (i.e. in the top rows in the widget) is growing hotter
… so forecasts are (currently) heading in the ‘wrong’ direction, if the concern is load shedding.
(C) Network limitations
Remember that what happened on 27th November 2024 was significantly impacted by network congestion:
1) both acting on the interconnectors (particularly VIC1-NSW1 as illustrated here in ‘The most recent 14 days of data for VIC1-NSW1’ view)
2) but also on the ability of generation options south of Sydney to collectively ship their available energy to the Sydney RRN (as Linton illustrated on Monday in ‘Curtailment concerns provide a view of the future’).
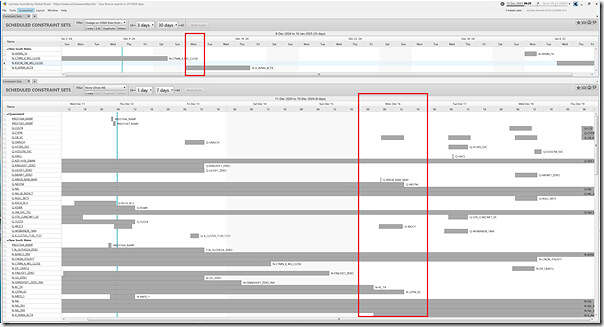
With this in mind, we use the ‘Constraint Sets’ widget in ez2view to take a quick look:
Note here that there are two copies of this widget above and below in the window, with different time ranges shown in each:
1) In the top widget we use our filter to focus on outage-related constraint sets pertaining to the 330kV network feeding in from southern NSW into the Sydney RRN:
(a) Of particular interest is the ‘N-X_AVMA_KCTX’ constraint set…
(b) Which we’ve not highlighted before in articles here on WattClarity
(c) But pertains to an outage on the ‘Avon to Macarthur (17) 330kV line and Kemps Creek No.2 or No.3 500/330kV transformer O/S’.
(d) We’ll drill into this one in more detail in a subsequent article (time permitting!), but the key point to understand is that this is a significant outage that would create similar conditions to what was seen on 27th November 2024.
2) In the bottom widget we have a zoomed in view of all of the constraint sets notionally allocated to QLD and NSW regions … noting that there are a number of other outage related constraint sets expected to run on the Monday 16th December 2024, so would need to drill in later to see what other effects there may be.
(D) Limitations on VRE
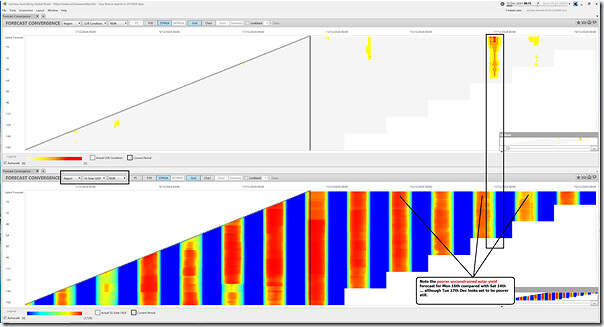
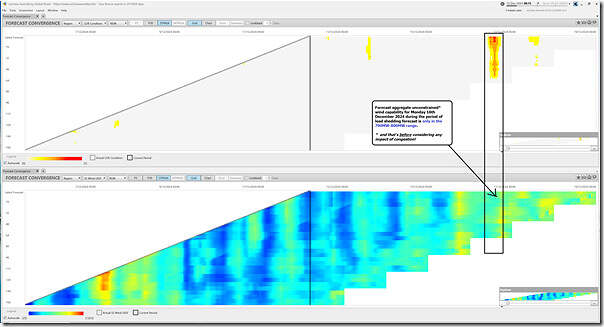
Using the ‘Forecast Convergence’ widget in ez2view again, we now take a look at projections for UIGF for firstly Solar and then Wind in NSW:
In this window we see (bottom widget) that the forecast aggregate unconstrained* solar yield forecast for NSW is poorer on Monday 16th December 2024 than forecast on Saturday 14th December 2024
… although for interest note that Tuesday 17th December 2024 looks set to be even poorer than Monday 16th December.
Looking at Wind, we see that the forecast is also that the aggregate unconstrained* wind yield will be pretty ordinary:
* Readers should remember that both of these UIGF numbers are unconstrained, so before even considering the impact of congestion (which Linton showed was quite material on 27th November 2024).
(E) Limitations on Coal units
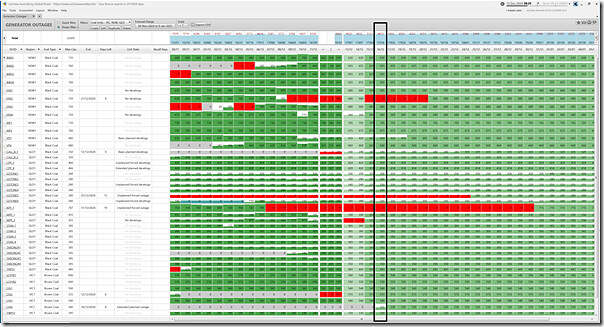
Finally, let’s end with a snapshot of the ‘Generator Outages’ widget in ez2view, filtered on coal units and with highlighting drawn around current MT PASA DUID (as at the 08:20 dispatch interval NEM time):
Amongst we see here are:
1) The unplanned outage on ER02 (which we noted here) will be continuing through until late next week
2) There’s a forecast that VP5 will be limited to part-load over the coming says, for reasons not explored here
3) With respect to CALL_B_1:
(a) It is due back today, but not yet … so watch this space
(b) Also note that it needs to be on part-load through Monday
4) GSTONE5 is on unplanned outage
5) KPP_1 is on an unplanned outage.
6) Noteworthy that LYA2 is due back today, but not yet … so watch this space
7) LYA4 is due back on Monday 16th December sometime, so watch that space also!
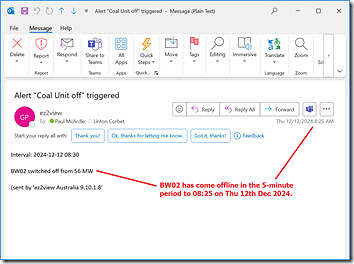
8) Also note that (not shown above) BW02 has also just come offline as well in the 5-minutes to 08:25, as captured in this ‘Notification’ widget email alert from ez2view.
So quite a few coal units to keep an eye out for
(F) Other Firming Assets?
No time to look at them in this article.
Oh my, is this going to be a loooooo……ooooong summer 2024-25?


Just on constraints in that forecast, there is a second relevant constraint set due to a current outage on Liddell-Tomago line 82 (set N-LDTM_82). This isn’t due to finish until 16:00 on Monday so overlaps with the Avon-Macarthur line and Kemps Creek transformer outage set (N-X_AVMA_KCTX) highlighted in the article. The joint effect of these outages would be significant limitations on flows into Sydney from both the north (QNI) and south (NSW southern generators and Victorian imports). There is no way known that AEMO will permit the Avon-Macarthur / Kemps Creek outages to begin on Monday. So the forecast currently looks worse than it will really end up being (unless there are generator failures between now and Monday).