Some readers will recall how we wrote ‘Unavailability of coal units hits 24% across calendar 2022 …’ on 6th March 2023
1) that article was one of the snippets shared from the 198-page GenInsights Quarterly Update for Q4 2022.
2) readers will recall that poor coal unit performance was one of the significant factors contributing to the 2022 Energy Crisis.
Last week we released GenInsights Quarterly Updates for 2024 Q2 … this followed form our belated release of the same for 2024 Q1. In that article I noted that we’d look to share a couple excerpts
(A) Aggregate unavailability has fallen significantly (i.e. an improvement)
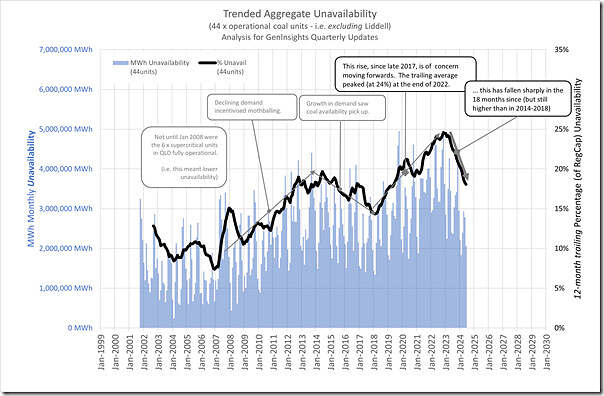
In the 18 months since the end of calendar 2022, the performance of the fleet of the 44 x remaining coal units has improved markedly … we can see this in the long-term trend of monthly aggregate unavailability of coal units (although some might say that this improvement has come off a low base):
With respect to this chart … and also the table immediately below:
(A1) Observations
A couple key points in the above:
1) The main points are that:
(a) At the end of 2022, the 12-month trailing performance (which hit 24%) was the worst performance recorded in the 20-year history;
(b) In the 18 months since that time, it’s dropped sharply to be ~18% at the end of June 2024.
(c) Though note that this is not the lowest it’s been over the ~20 year history (or even the lowest in the past 10 years).
2) But it’s also worth noting that this trailing measure of performance looks set to improve further through until mid 2025 (barring calamity with the units):
(a) Because of the 12 month trailing nature of the metric;
(b) This metric has not yet seen the roll-off of the effect of return to service at Callide C:
i. With Callide unit C3 having come back online on 1st April (after 518 days offline) … and then just last week after it’s 21-day forced outage.
ii. With Callide unit C4 slated to return to service within a week:
… the snapshot of the ‘Generator Outages’ widget in ez2view shown in this article about Eraring earlier today shows expected return to service still being this coming Saturday 31st August 2024.
… after more than 3 years offline.
(A2) Methodology
Keep in mind that (with this chart, and the table below) several points on the methodology:
1) Older units that have since retired by this point in time (e.g. Hazelwood, Liddell and others) have been excluded from the analysis, in order to ensure the 20-year history shown above uses the same sample set:
i.e. the 44 x ‘still operational’ coal units … which are:
i. 22 x coal units in QLD
ii. 12 x coal units in NSW
iii. 10 x coal units in VIC
2) In all cases, we have used ‘Registered Capacity’ as the measure of a coal unit’s capacity:
(a) For reasons explained here, it’s typically the ‘best’ measure for a coal unit’s capacity (not so much for wind and solar, for instance)
(b) Though there are some exceptions, as you’ll see below.
(B) It’s not a homogenous bunch!
Too many people I see fall into a ‘trap’ in assuming that all coal units are similar, in terms of their performance … however as we’ve noted in the GenInsights Quarterly Updates series (and GenInsights21 before that), they are not a homogenous bunch.
… some units are performing quite well (though it’s not often talked about) whilst other units are clearly quite challenged (much more commonly noted, including in articles here on WattClarity).
From the latest report, here are two extracts:
B1) Twenty+ years of history
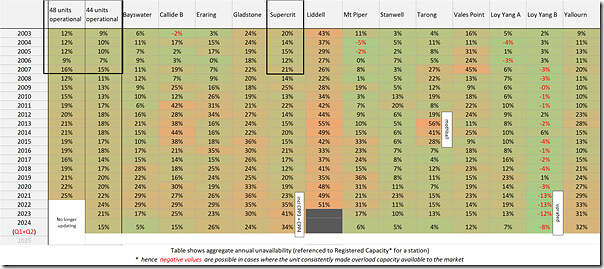
Taking the same ‘unavailability’ data as used to produce the chart above, here’s a tabular view of a long run of history of annual unavailability (by calendar year) looking back to (part year) 2001:
Data is aggregated to station
… but keep in mind that, to save on table width, we’ve been bundling the 6 x supercritical units in QLD together through these reports.
Remembering that the row for 2024 is only for a half-year (so the numbers are typically lower if there’s not been any planned outage performed on the units in this 6 month period), we see that performance for 2023 and 2024 ytd is mostly improved on 2022. We can (also) clearly see that these stations have quite different performance profiles :
1) Some (units and) stations have been performing quite well.
2) Some (units and) stations are longer in life and so (for this reason and perhaps others) are more challenged to operate.
B2) The past 12 months
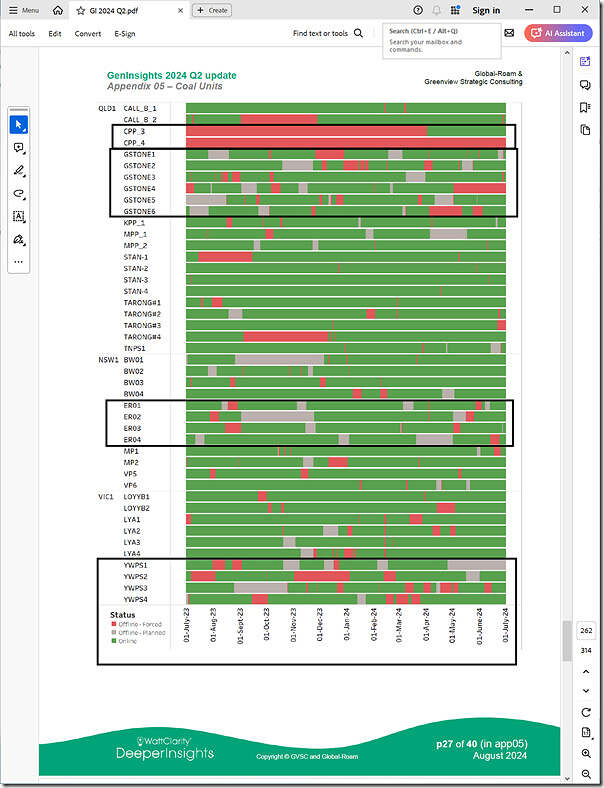
A different extract from the report is this page, which shows a Gantt-chart style view of our internal derivation of a time range in which the unit’s been in one of three states:
GREEN = Available,
RED = on a (full) Forced Outage,
GREY = a (full) Planned Outage:
This chart spans the 12 month period to 30th June 2024.
Note that this method has pre-dated the AEMO’s publication of upgraded MT PASA DUID Availability data from 9th October 2023, so we have (at least to this point) persisted with the pre-existing automated method that looked deep in the bids to ascribe outages as ‘planned’ or ‘forced’.
Hence the data won’t line up 100% with data shown in the ‘Generator Outages’ widget in ez2view (for instance):
1) It will be fairly close;
2) But it does not take into account Economic Outages (i.e. shown in turquoise in the widget) for instance.
(C) Particularly highlighting some highlights and contrasts
Some quick observations:
1) There are 8784 hours in the (leap) year – of the 44 units shown:
(a) There are 32 units with Forced Outages lower than 10% of the year (i.e. less than 878 hours in red … glass half full)
… of these, there were 14 units available more than 8,432 hours (i.e. more than 96% of the year no Forced or Planned Outages)
(b) But this means there were 12 units with Forced Outages more than 10% of the year (glass half empty)
2) Also note some contrasts:
(a) Have a look at the difference in performance between (well performing) Loy Yang B and (older and more challenged) Yallourn in Victoria
(b) Similarly, keep an eye on the difference between the (well performing) Stanwell and the (older and more challenged) Gladstone in QLD.
3) I’ve also highlighted:
(a) Callide C, because of the long outages (that are thankfully ended or ending); and
(b) Eraring, given the recent extension decision.
4) No doubt you’ll make your own observations
(D) Some things to watch out for, in the ESOO…
As such, when the 2024 ESOO comes out later in the week, I’ll be interested to see:
1) Whether the EFOR (Equivalent Forced Outage Rate) for coal units has been adjusted from what was assumed in the 2023 ESOO … and, if so, how and why?
2) I’m also interested to see whether the AEMO continues with the approach taken in the past – in which it’s produced a common EFOR for all coal units in a region:
(a) such as noted here for the 2023 ESOO
(b) which, as we can see in the above, is a simplification … so those familiar with the Monte-Carlo processes used in modelling processes such as for the ESOO can think about how that might influence the results derived.
That’s all for now…


Leave a comment