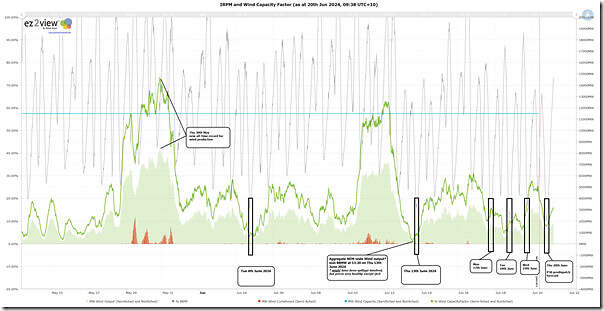
In recent evenings this week (specifically Monday 17th June, Tuesday 18th June and Wednesday 19th June) we’ve posted articles looking at instances where the NEM-wide IRPM has dropped to quite low levels after sunset, along with other factors including:
1) Some coal units offline; and
2) Aggregate wind harvest low.
This has all (combined with other factors) placed stress on the gas supply system/market … both for domestic heating in the southern regions, and for gas powered generation.
So I thought I’d take a quick look at the correlation between low IRPM and low Aggregate Wind Generation, using the ‘Trends Engine’ inside of ez2view. Here’s a trend I put together this morning looking back 28 days, and forward ~1 day into P30 predispatch:
Frequent readers will remember that:
1) They can click on the image to open as larger resolution in another tab, to read in conjunction with the following; and
2) Those with a licence to ez2view can open their own copy of this trend query here.
I’ve deliberately gone back that far so that the trend highlights the two big bursts of strong wind output:
1) Spanning ~3 days at the end of May and including the new all-time record on the evening of 30th May
(a) at which point we see instantaneous Capacity Factor for Wind across the NEM almost reached 75% … a very impressive level
(b) which is even more impressive when seeing some clearly visible levels of spillage (curtailment for network and/or pricing reasons) over the same period
2) Spanning ~3 days from late on 10th June
That helps to provide some context to why I’m correct in saying that aggregate instantaneous wind capacity factors over the recent evenings have been quite disappointing … and also somewhat concerning, thinking into the future.
| Day | Statistics |
|---|---|
|
Monday 17th June 2024 |
On Monday evening 17th June we saw a ‘90-minute run of IRPM < 15% on Monday evening 17th June 2024’ with the lowest point being down at 11.76%. At the same (i.e. 17:55) dispatch interval we saw ‘Market Demand’ peak at 31,948MW. During the period of low IRPM we saw Wind Capacity Factor slowly ramp up, to reach a ‘height’ of only 16%. |
|
Tuesday 18th June 2024 |
On Tuesday evening 18th june we saw well over 120 minutes of IRPM < 15%, with the lowest point being down at 10.89%. That same (i.e. 18:25) dispatch interval saw ‘Market Demand’ peak at 31,842MW. During the period of low IRPM we saw Wind Capacity Factor barely rise above 10%. |
|
Wednesday 19th June 2024 |
Yesterday evening 19th June we saw a ‘shorter and shallower bout of low IRPM …’, with the lowest point being ‘only’ 13.85%. On the flip side, the same evening saw ‘Market Demand’ up at 32,262MW … so higher than seen on either on Monday 17th June or Tuesday 18th June. During the evening period yesterday we saw Wind Capacity Factor rise above 25% … which is one of the reasons IRPM was not as low as the prior 2 days (especially with demand being higher).
|
|
Thursday 20th June 2024 |
It’s only a forecast at this point, but the current forecasts suggest that IRPM might even drop to under 10% this evening … which is a very, very rare occurrence in the history of the NEM! Currently AEMO forecasts have wind capacity factor forecast to be just under 10% this evening as well, coincident with the low IRPM (and peak demand). Let’s wait to see what actually unfolds … |
Clearly there are some challenges to grapple with, in a ‘VRE + Firming’ path being taken for this Energy Transition.
That’s why it’s crucially important to pay close attention (as we do, in each GenInsights Quarterly Updates) to Aggregate Scheduled Target, as an indicator of the ongoing requirement for firming capacity. The numbers right now seem to indicate another period this evening where >30,000MW of firming capacity was required.
PS1 events earlier in May/June, highlighted in the chart
Also worth flagging the other periods highlighted on the chart.
| Day | Statistics |
|---|---|
|
Thursday 30th May 2024 |
|
|
Tuesday 4th June 2024 |
We’ve highlighted the evening of Tuesday 4th June 2024 because the IRPM dropped below 20% on that evening. There are several articles written with respect to this day collated here on WattClarity. |
|
Thursday 13th June at 13:20 |
We’ve noted in the chart that the aggregate output from all the wind farms in the NEM was a very meagre 88MW at the 13;20 dispatch interval. This has now been addressed specifically in ‘A brief review of the (only!) 88MW of wind output NEM-wide at 13:20 on Thursday 13th June 2024’. |
|
Thursday 13th June |
We’ve highlighted the evening of Thursday 13th June 2024 because the IRPM dropped below 20% on that evening. There are several articles written with respect to this day collated here on WattClarity. |


Leave a comment