It’s Monday 1st April 2024, so we’re now just under 7 weeks under the ’Major Power System Event’ of 13th February 2024, triggered by some wild weather that included (bushfires leading to the unexpected shutdown of a large wind farm as a preamble before) strong winds destroyed 6 transmission towers (prompting some questions and), leading to some significant load shedding.
But there’s still plenty of questions left to explore, as time permits – including:
1) On 14th February (i.e. next day) we posted Some Initial Questions in the article ‘Some *initial* headline questions following the transmission damage, unit trips & loss of load, initiated on Tuesday 13th February 2024’ here.
2) There were 27 Observations/Questions about on-the-day events in the article ‘A quick first pass through ENERGY bids (for Victorian units) on Tuesday 13th Feb 2024’ on 17th February.
3) There were also 28 x Observation/Questions about on-the-day events in the article ‘From the 4-second SCADA data, a view of Production by Fuel Type on Tuesday 13th February 2024’, published on 18th February.
4) Plus there have been others occur to us in other ways as well … including via suggestions from readers.
Taking another step towards answering some of these questions, today we’ll take a look at how aggregate exports from Victoria changed with the events that occurred on that day… again using the 4-second data:
Net exports (or imports) from Victoria
Let’s start with the 14-hour sample of AEMO’s 4-second data that we initially saw in Allan’s early observations, and then:
1) In this ‘14 hours of trended (mainland) frequency on Tuesday 13th February 2024’; and then
2) In the article ‘From the 4-second SCADA data, a view of Production by Fuel Type on Tuesday 13th February 2024’, published on 18th February … which then led into deeper dives into several assets including:
(a) Stockyard Hill Wind Farm; and
(b) Moorabool Wind Farm; and
(c) Berrybank Wind Farm; and
(d) Most recently, the Victoria Big Battery.
… there are obviously many more assets to look at.
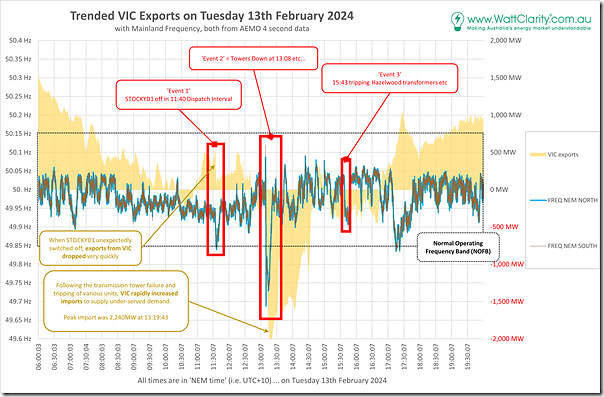
However in this article we’ll take a different approach, by looking (in aggregate) at net electricity exports from Victoria through this 14 hour window (or imports being negative):
Keep in mind that VIC is interconnected with TAS (via Basslink) and SA (via Heywood and Murraylink) and NSW (via VIC1-NSW1). So the trend above is the aggregate of the flows, remembering that dispatch is such that a region can be importing at one end and exporting at the other end.
It’s clear to see that:
1) At the start and end of the chart VIC was a net energy exporter
… which is not a surprise for those who have been reading the quarterly summaries of inter-regional interchanges in Appendix 6 of GenInsights Quarterly Updates (one of two regions that consistently are net exporters in aggregate).
2) But VIC quickly became an energy importer from ~13:00 to ~17:00 NEM time …
… with a rapid ramp up on imports at the time of the transmission tower failure that started Event 2.
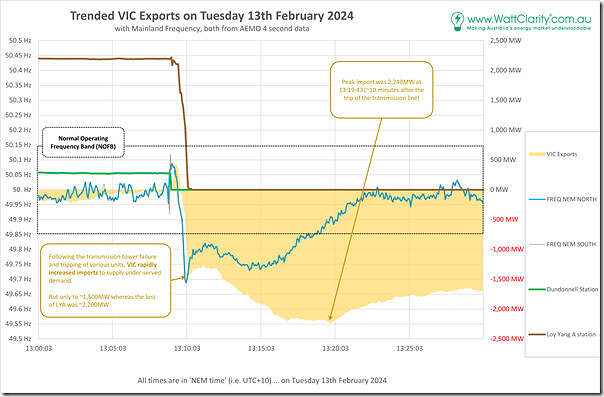
So we zoom in and take a closer look at the half hour period 13:00 to 13:30 …
In this case we see a few interesting things:
1) In the first ~minute following the destruction of that transmission flow path, Victoria rapidly ramped up net exports … though this was short-lived.
2) In conjunction with the large loss of generation from Loy Yang A station, flows rapidly reversed and VIC became a large importer within seconds.
(a) remembering that the 4-second data has some peculiarities about timestamps, we can’t be absolutely sure on the exact timing, other than to say that flows swung around very quickly after (or in line with) the drop in frequency as Loy Yang A fell offline.
(b) seems likely that this rapid ramp was as a result of out-of-Victoria Primary Frequency Response (PFR):
… in a later article we might look more closely at where this came from (e.g. location, and which types of plants).
3) I’ve noted on this chart that there’s a ~750MW gap between the 2,200MW of supply lost from Loy Yang A …
(a) actually it’s a larger gap, given the ~2,450MW loss of supply from Dundonnell and Loy Yang A) and the ~1,500MW gained from rapid imports.
(b) this gap roughly matches the ~950MW load initially ‘shaken off’ in the disruption.
4) Over the ~10 minutes from 13:10 onwards, net imports increased by ~750MW … potentially in conjunction with some of that load initially ‘shaken off’ being reconnected.
Interconnector flows
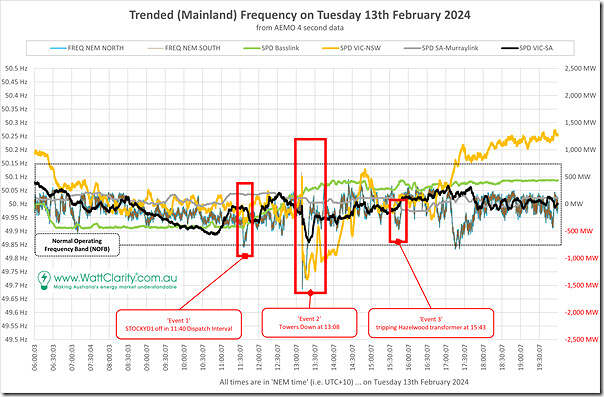
With the above in mind, let’s look at the four Victorian-connected interconnectors (i.e. omitting QNI and Directlink to make the chart less busy):
In the 14-hour window above, it should be evident from the display that metered flows on the two AC-interconnectors are much more volatile than the metered flows on the two DC-interconnectors (Directlink and Murraylink).
… that’s because the AC interconnectors are not ‘controlled’ in the same way the DC interconnectors are.
Remember also that these interconnectors have a number sign that can be thought of as ‘Hobart centric’:
1) Flow away from Hobart (to the north, and the west) is positive; whilst
2) Flow towards Hobart (to the south, and the east) is negative.
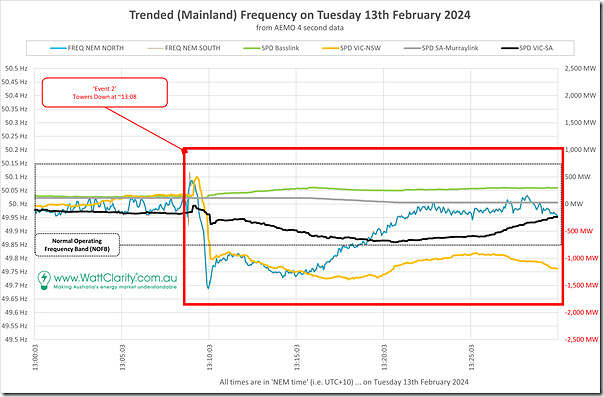
Zooming into the 30-minute period at the start of Event 2 (i.e. 13:00 to 13:30) we see the following:
So in this case we see that the response of the interconnectors is as follows:
1) For the VIC1-NSW1 interconnector, the variation is the largest (which is in line with its overall size):
(a) Immediately after the towers are downed, the flow increases towards NSW, but that is shortlived;
(b) With Loy Yang A rapidly coming offline, the flow switches to import up to 1000MW by the 13:10 mark.
2) For the Heywood (i.e. VIC1-SA1) interconnector, the pattern is somewhat similar:
(a) Immediately after the towers are downed …
i. the flow can be shown as jumping upwards on the chart.
ii. but (because it was below 0MW beforehand) means a reduced flow from SA into VIC;
(b) With Loy Yang A rapidly coming offline, the pattern is more clearly:
i. A gentler decline (i.e. importing more from SA));
ii. Before a rapid drop at ~13:10.
3) For the Basslink interconnector, this does not really visibly change (at this scale) until ~13:00
4) Seeing Murraylink on the same chart, as a smaller size interconnector any change is more difficult to see, but it appears that:
(a) It was exporting (VIC to SA) at the time of the trip; and
(b) Took about 10 minutes (to ~13:20) to ramp down to about 0MW.
That’s all for now…


Be the first to comment on "Focusing on VIC exports (and imports) with the ‘Major Power System Event’ on Tuesday 13th February 2024"