The February 2024 release of the GSD (Generator Statistical Digest) expands to display, for the first time, bids and enablement levels of units participating in the 10 Frequency Control Ancillary Service (FCAS) markets in the NEM.
Readers will find the FCAS Registered Units – 10 Year History in Volume 1 of GSD 2023.
There is a page for each registered and participating unit:
There is a lot of information to process, as a reader. And each reader, having their own interests and perspectives, may well take a choose-your-own-adventure approach to reading the publication.
In this article I’ve started to inspect the 10-year FCAS history section. Three units of differing technology and makeup stood out:
Thermal Generator in QLD
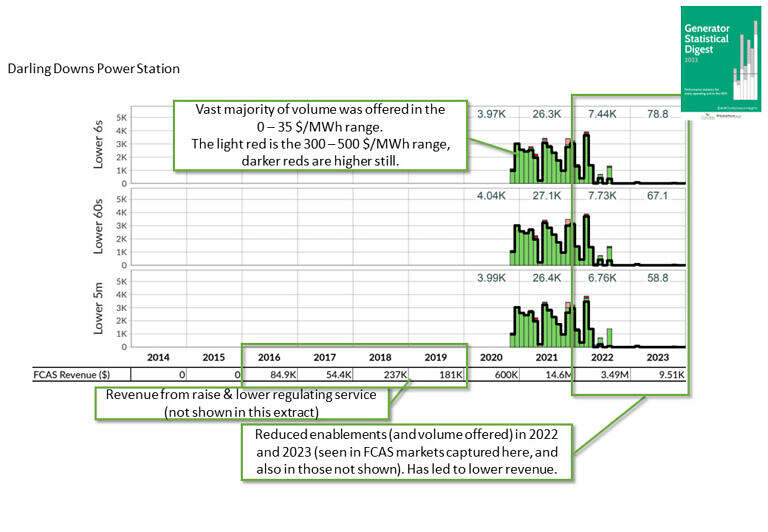
Here’s a portion of the bottom part of the FCAS History for Darling Downs Power Station in QLD.
The annotated image stands out initially for the lack of bids and enablements since mid-2022 in the lower contingency services pictured. A similar feature can be seen in the raise services that the unit is registered for.
We also note the colour of the bid bars – mostly green – indicating bids > 0 $/MWh and < 300 $/MWh. The lighter the green the lower the price range.
Battery in VIC
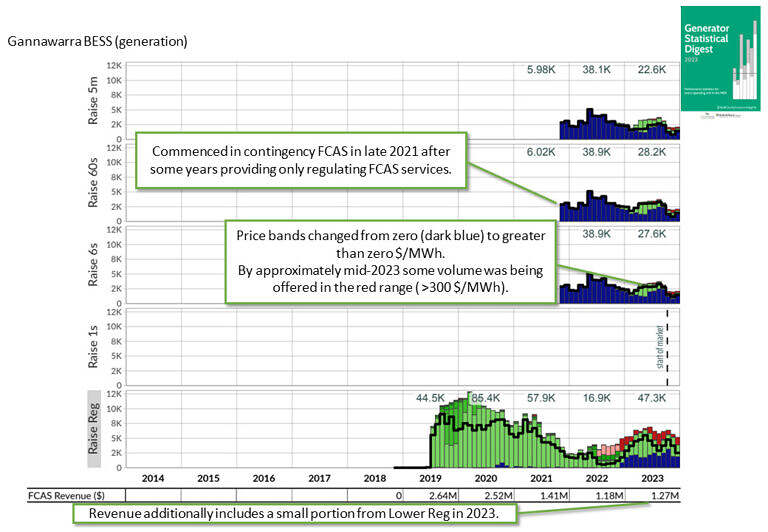
Batteries continue to make a significant contribution to FCAS markets. Gannawarra, in VIC, started out in 2019 providing regulating services and then expanded into contingency services in 2021.
In 2023 (and 2022 since June) it appears to have adjusted its bidding to offer volumes at more diverse prices ranges.
Ancillary Service Provider Unit in QLD
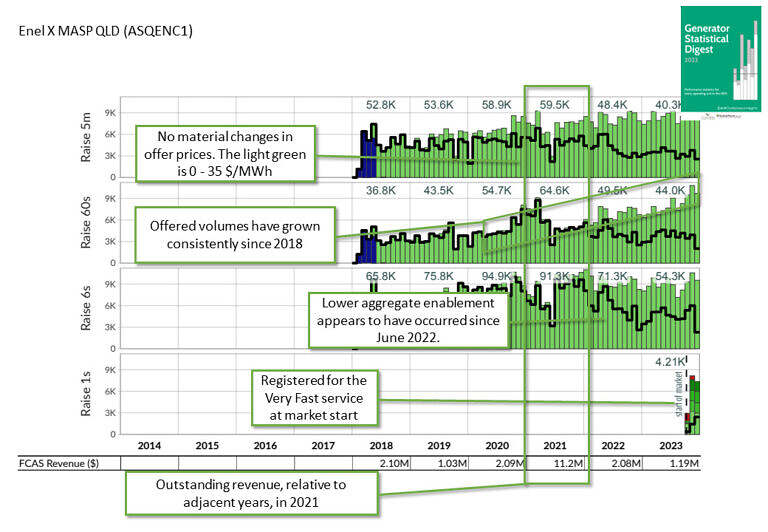
Enel X’s ancillary services unit in QLD ‘ASQENC1’ represents an aggregation of sites capable of providing FCAS. This represents one of the many new types of units that participate in FCAS markets without participating in central dispatch of the the Energy market.
This example shows the Queensland unit began in 2018. After some early months offering capacity at 0 $/MWh the unit’s capacity was consistently offered in the 0-35 $/MWh range. And until 2022 almost all availability appears to have been enabled.
2021 doesn’t look particularly atypical, based on the charted bids and enabled volumes, yet the spot revenue was very strong relative to the adjacent years.
A changing of the guard is emerging
Analysts who order the optional extra – the csv data extract – will have the table and chart data from the 3 Volumes of GSD2023 in a convenient digital form.
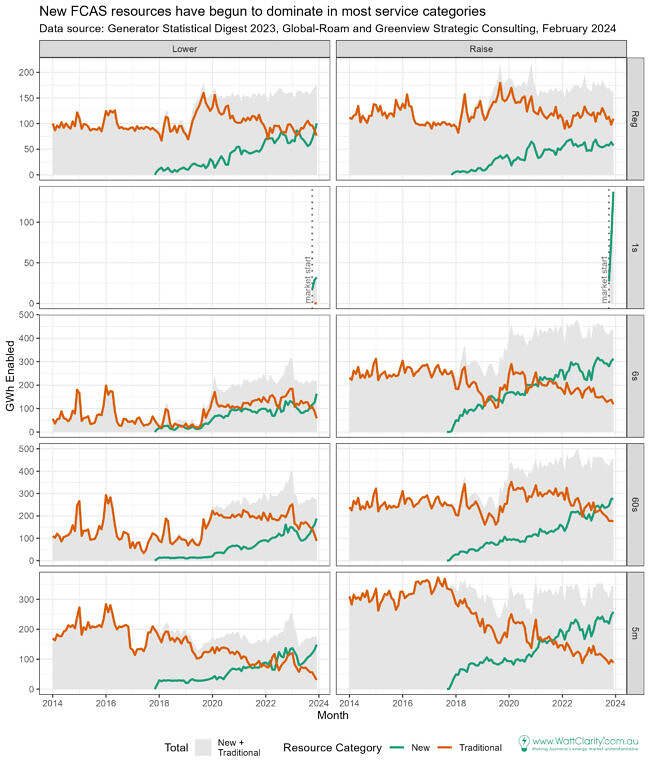
I’ve used the csv data extract to present the following summary of FCAS volumes enabled, using the GSD’s 10 year history. This means adding up the black lines on from the charts above, grouping by market and a custom resource category label.
I’ve used two custom resource categories to distinguish:
- Traditional: Traditional FCAS resources such as thermal generators, hydro generators and pumps, aluminum loads, and
- New: New types of FCAS resources such as batteries, Virtual Power Plants (VPPs), aggregations, demand response units.
- This category starts in late 2018, when the Hornsdale Power Reserve (a big battery in SA) commenced operation.
A chart of the result, below, uncovers how New FCAS resources are becoming the predominant source of enabled FCAS in almost all markets.
Total levels of FCAs enabled haven’t changed much since 2020.
A clear decline in enabled volumes from Traditional resources is evident. The gap is being filled by enabled volumes from New resources. The greatest gains have been seen in Raise Contingency services, and also in the Lower 5min service.
Are enabled volumes, relative to availability, increasing?
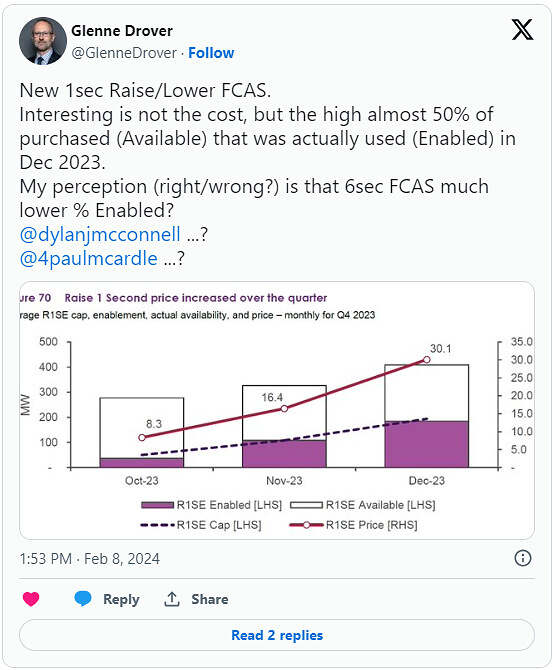
Inspired by a tweet on X, remarking how the enablement of the new 1-second Raise service has risen relative to available levels, I’ve used the GSD2023 data extract again to look at this statistic, but go back further, and span across all FCAS markets.
The tweet captured a chart from AEMO’s Quarterly Energy Dynamics report (for Q4 2023) and touched on how the relative percentage enabled of 1Sec Raise had risen over the quarter to remarkable level (almost 50%):
“Is the % enabled of 6Sec Raise FCAS much lower than the December level for 1Sec Raise?”
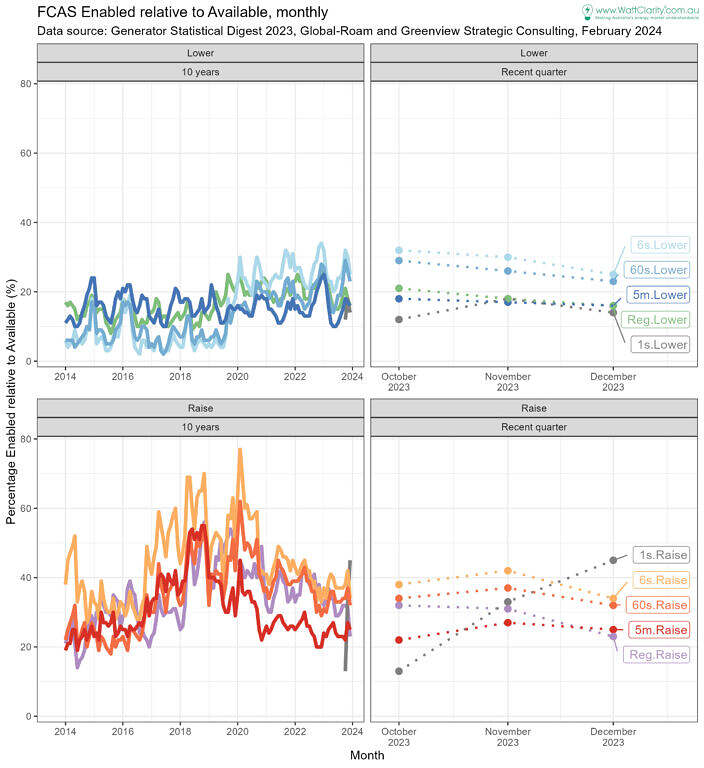
To answer, we can inspect the chart below and draw out the following:
- The 1 Sec Raise percentage in December 2023 was 45%.
- The 6Sec Raise percentage in December 2023 was 34% of available.
- A month earlier, it was 42%, in November 2023.
- We might conclude this is a bit lower, but not substantially? – Subjective, of course!
- 6Sec Raise has typically been enabled at the highest % relative to availability, out of all all FCAS markets.
- Typically, from 2022 and 2023 months, the Raise 6Sec enablement has generally been between 35% and 45% of available.
- Prior years have seen enabled levels (monthly-aggregate) nudge 70%, relative to availability. These extreme levels occurred in 2018 and 2020.
Now, we know enablement requirements are currently capped for both 1Sec markets.
Coincidentally the cap level for 1Sec Lower was due to move from 100 to 120 MW on Monday 12 February, 2023 (market notice 114358). The 1Sec Raise cap was not due to change from it’s present level of 225 MW on that same Monday.
The capped requirement levels are in place to ensure there is adequate availability to meet the required levels in dispatch. And in Very fast FCAS markets continue to grow, December 2023, we saw how the 1Sec Raise continues to be regularly enabled at the capped level.
So, for 1Sec Raise, we may anticipate that the percentage enabled will stay steady until either:
- Increased availability comes into the market driving the percentage lower, or
- The requirement cap is increased allowing more to be enabled, driving the percentage higher, or
- Perhaps most likely, some combination of both cap and availability increase.


Leave a comment