
Editor’s note: Each year we invite energy analyst, David Leitch, to review our annual Generator Statistical Digest, and share his top insights on WattClarity. It was no different again this year as here David shares his key takeaways from reading his pre-print copy of the publication. The GSD2023 is scheduled to be released later this week – you can order your copy using this form.
A definitive reference
Global-Roam and Greenview Strategic Consulting have released the 2023 edition of the Generator Statistical Digest. Each year the digest grows running close to 1200 pages for the 2023 edition and undoubtedly the premier reference in the industry.
In this analyst’s opinion, the GSD is worthy of a website in itself, notwithstanding that the vast quantity of data that has been summarized, analysed, and coherently presented is by nature static and wont change until the next edition.
Each edition produces new sections and this edition provides more organization and emphasis on FCAS. Nevertheless, there is performance data on every AEMO DUID.
As an analyst my own focus generally is on having reliable data that can be massaged, even tortured, into the form required to provide insight into some analytical question. The skill, if there is any, lies partly in knowing what questions need to be asked always bearing in mind the epigram adorning the front page of Copeland and Weston’s “Corporate Finance” namely that the questions remain the same but the answers change.
Its no secret that the NEM is changing rapidly, and many questions are asked about that change. Looking at the GSD it’s already very obvious that the number of DUIDs is expanding very rapidly. At a guess, there are about 427 DUIDs covered in the GSD. In my estimation in about another 5-6 years, there will be little focus on the remaining coal generators and much more on the performance of the more diversified generator set that is being built to replace the coal generation.
As I mentioned last year, you cannot hope to understand the NEM in all its beauty without a good appreciation of behind-the-meter solar and increasingly behind-the-meter storage. Behind the meter is the classic case of the power of numbers and is of course, considered as a whole, likely by far the most predictable and reliable source of generation in the NEM. How much more comforting it is to know that we depend on millions of small units rather than a few large units. If only solar ran for more than say 8 hours a day.
Equally although its important to understand FCAS revenue, its just as important or more so in the next few years to understand LRET revenue as this can be an important driver of generator behaviour.
Batteries are becoming significant.
Over the past couple of years one technology, initially the butt of jokes, has come to be taken very seriously and captured a big share of the incremental investment dollars. And that’s batteries, or for engineers, never satisfied unless there is an acronym, its BESS. Its become clear that the role of batteries, evident to me for close to a decade, is moving from the fringes to the mainstream. In the case of the NEM, we can think of the fringe as FCAS or ancillary services, to firming wind and solar, [VRE]. Even on the fringes its now I think, accepted by the industry that batteries are the ideal technology for frequency control, capable of virtual inertia as well as very fast frequency control. Cost reductions driven by learning rates seen in the use of batteries in EVs are now seeing developers start to choose batteries over pumped hydro projects even in the 8-10 hour duration task. Development times are so much faster, and environmental and more broadly social license issues are so much easier even if the useful life is much shorter.
Battery revenue by source
The GSD is indexed by alphabetic DUID. Unfortunately there is no “fuel type” index. I was interested to find out where batteries get their revenue from and how this is changing. The GSD does a great job of presenting this information. For instance if I look up the battery that got the ball rolling in Australia, that is the Hornsdale Power Reserve [HPR]:
- On pages 682 and 683 I can see details of HPRL1 (the load component), with the revenue chart from p682 shown below;
- Not shown here is (on p680 and 681) the details for HPRG1 (the generation component) … so noting there is also a revenue chart for that, which contains more red, orange and yellow (for FCAS Raise services).
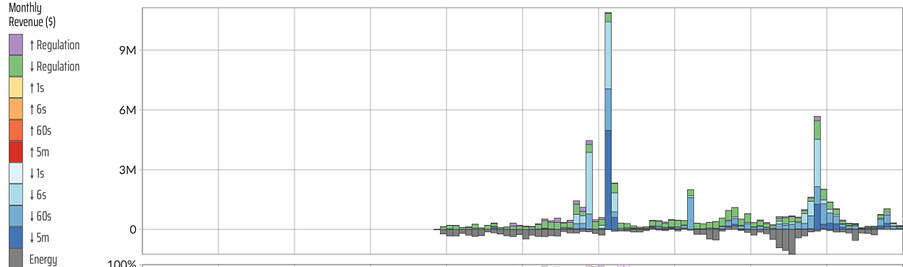
Figure 1: Hornsdale Power Reserve, monthly revenue by segment.
Source: GSD2023
From this, I can see that HPR’s (load side) revenue:
- is lumpy; and
- on the load side, much of that revenue is derived from lowering frequency.
- Being a load, it’s also understandable that it had negative ‘Energy’ Revenue … i.e. because it is purchasing at spot to fill.
Using the excellent Global-Roam NEMreview v6 product which does allow selection by fuel I was able to identify the 16 utility batteries that were in operation at one time or another in the NEM in the past year. I used these with the GSD to produce an analysis of batteries by revenue source for all of 2023.
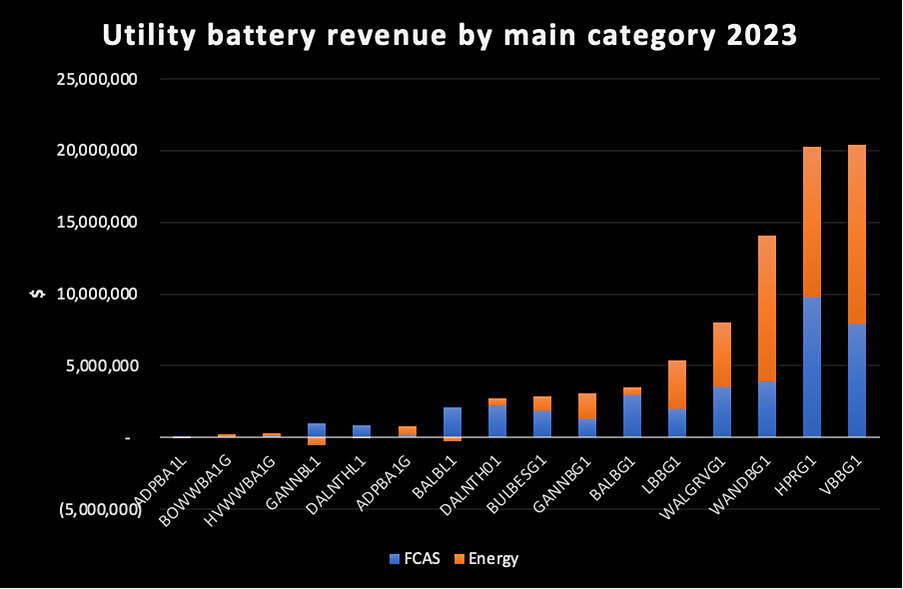
Figure 2 NEM batteries revenue 2023.
Source: GSD2023
Readers should note that battery analysts are really interested in the “spread” revenue rather than just “sales” as the battery energy has to be bought as well as sold. Still based solely on the chart it seems that the sale of “energy” is a big share of category revenue.
Looking at only the FCAS revenue it’s interesting to see that although “raise contingency” is the main sector driver a couple of batteries had lower contingency as the main source.
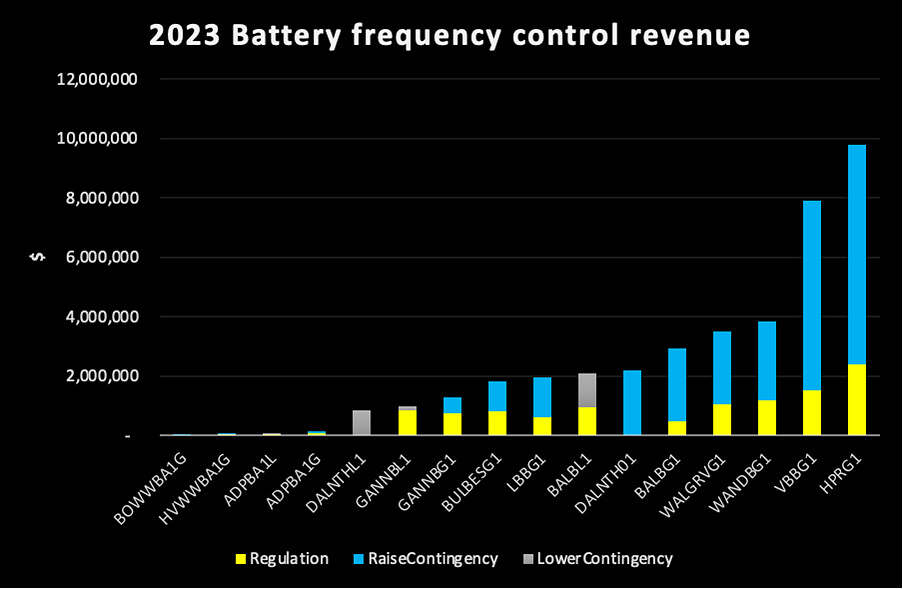
Figure 3 NEM battery FCAS revenue 2023.
Source: GSD2023
In terms of forecasts I expect both energy and FCAS revenues to grow over time. As the coal generators close batteries will provide all the frequency control in an inverter based grid. To the best of my knowledge based on discussions with the technical people this is not something to be feared but rather embraced. Batteries can be widely distributed in the grid providing resilience at many points to frequency shocks.
Coal units dominate the top revenue DUIDs
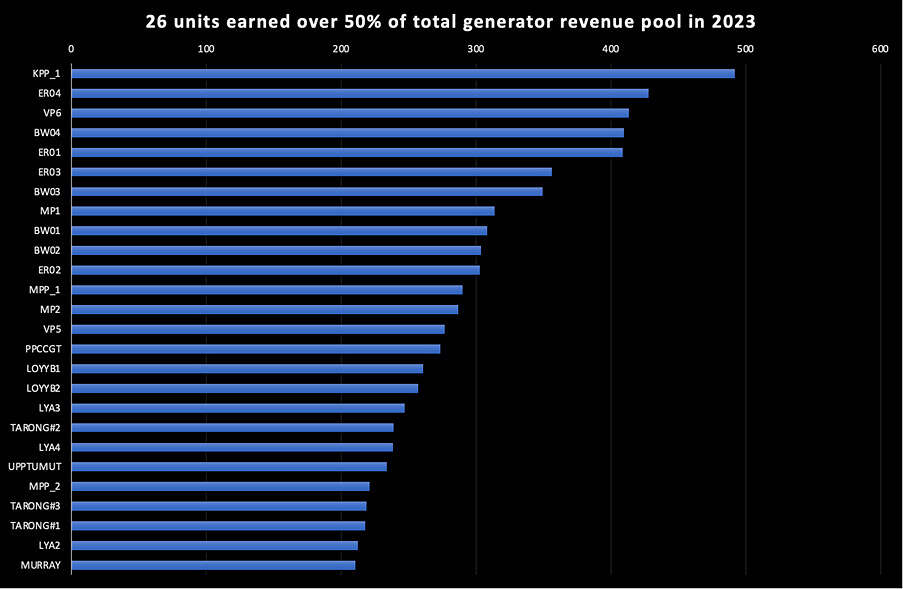
Figure 4 Top revenue earning units in the NEM 2023.
Source: GSD2023
Demand response achieves the highest volume-weighted prices but…
Demand Response volumes are tiny as yet and I don’t focus on them. For both producers and consumers what really matters is average day peak prices. For instance, the following figure shows the average time of day price over the past year for selected states.
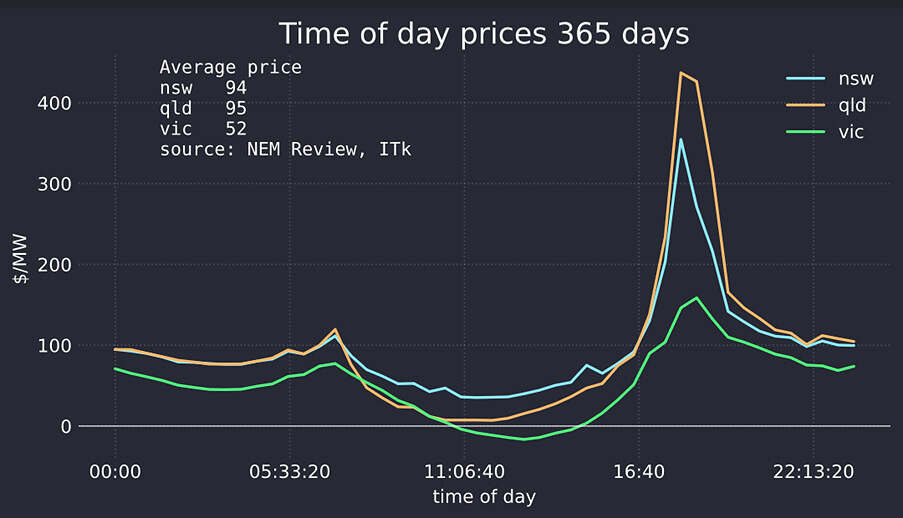
Figure 5 Major state average time of day prices, last 12 months.
Source: NEM Review
It’s clear that the average time-weighted price is impacted by peak prices. For instance, for NSW last year keeping the average maximum half-hourly price to $130/MWh (above the fuel cost of gas) drops NSW prices by over $10/MWh.
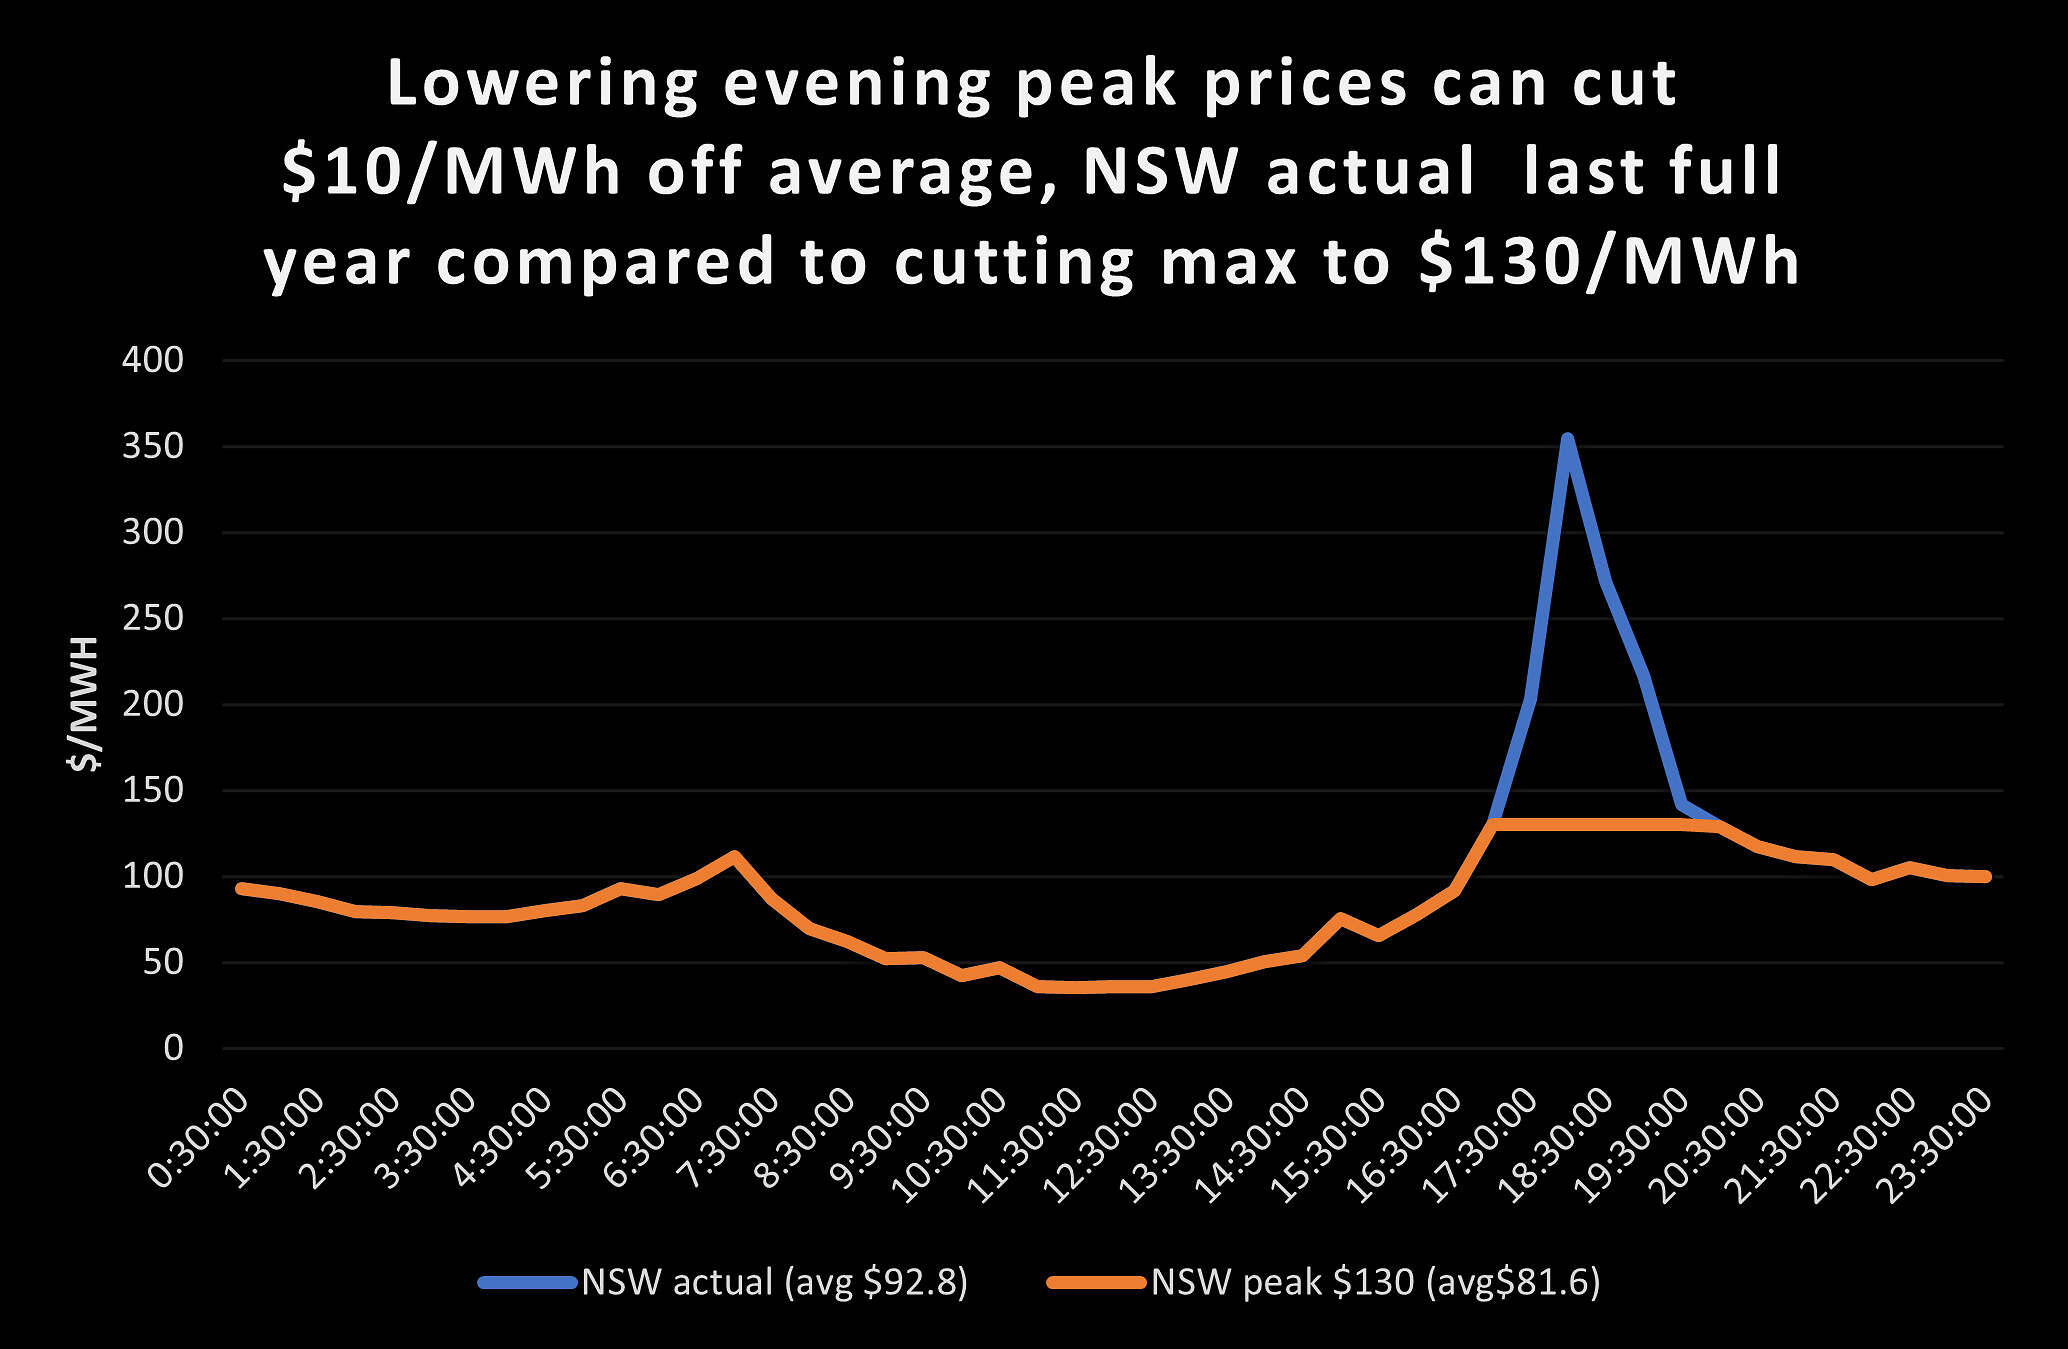
Figure 6 NSW actual prices and impact of lowering only evening peak prices.
Source: NEM Review, ITK
Batteries are already choosing to price above gas in some instances, but as more batteries are built there will essentially be more competition to be dispatched and peak prices will come under pressure. Or at least that is my expectation.
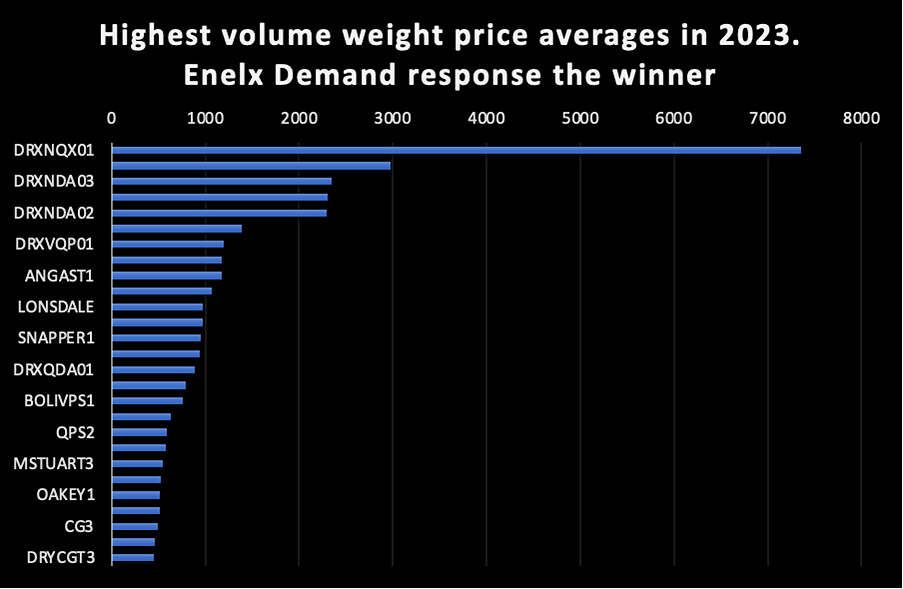
Figure 7 Highest average price earners in NEM.
Source: GSD2023
Finally at this glance through the GSD what about the lowest price receivers?
Certainly there were, as you would expect, some solar farms near the bottom of the list. Kiama Solar Farm 1 average price was $12/MWh, GLENSF1 (Glen Rowan) did worse averaging -9.71/MWh. Essentially it was generating to earn RECs, not really a happy place should its PPA expire and conditions not have changed.
However it was interesting to see, given that AGL received just $22/MWh for Macarthur wind farm, one of the largest in the NEM.
About our Guest Author
 |
David Leitch is Principal at ITK Services. He has 33 years of experience in investment banking research at major investment banks in Australia. He was consistently rated in the top 3 for utility analysis between 2006 and 2016.
David has been a client of ours, and a fan of NEMreview, since 2007. He has been a long-time contributor of analysis over on RenewEconomy, and very occasionally contributes to WattClarity! You can find David on LinkedIn here. |
Great, you’re celebrating the fact that the FCAS market will increase when coal generators close down. What about the small matter of the ENERGY that is lost when those coal generators are gone? Funny how little you talk about battery energy. Most battery-pushers, like yourself, always underplay energy and instead love to gloat about nominal capacity levels.
How does your battery future work when Eraring closes next year (which you’re obviously pushing)? Eraring’s daily energy is probably at least 50 GWh all day everyday (taking into account cycling and not running at full output all day). At the moment, the biggest battery in NSW is the Riverina and Darlington Point BESS with a whopping 0.3 GWh of energy! Incredible! It’s safe to assume that whopping 0.3 GWh would be a daily limit since batteries will generally run a single cycle in one day.
I know it’s really exciting that these batteries can enjoy some of that coal FCAS cake but what about the small issue of losing 50 GWh of energy and replacing it with technology that offers 0.6% of its energy.
“How much more comforting it is to know that we depend on millions of interconnected small units rather than a few large units.”
That’s incredible. You’re saying that managing millions of small independent units is way more comforting than several giant units. You should become an engineer! Lets totally ignore the worsening DER problems on the distribution networks such as voltage regulation, phase imbalance and congestion.