Yesterday evening (Saturday 16th November) the Heywood interconnector tripped, islanding the South Australian region from the eastern regions of the NEM.
I was supposed to be doing something else today, but did field a few questions externally which (stoked by natural curiosity) has distracted me for a bit!
However we do have these two big reasons for allowing ourselves to be ‘distracted’ by events like these. Hence I hope you’ll find this initial review of some value – and, of course, please do let us know what I have missed, or misunderstood?
(A) Automated responses triggered for 18:20
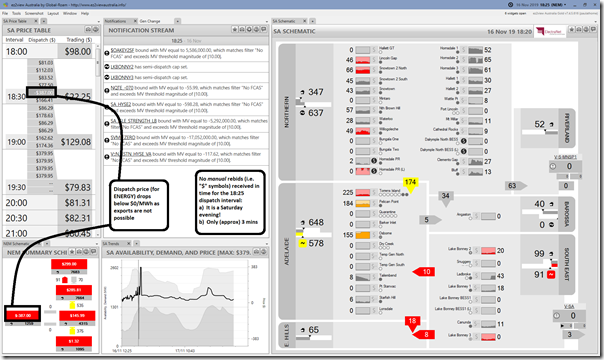
Here’s some of the dispatch outcomes published (at 18:15:20 for) the 18:20 dispatch interval seen via a snapshot from ez2view time-travelled back to this first dispatch interval immediately following the trip:
(Click on the image for a larger view)
This is the first dispatch interval where AEMO’s dispatch target flow for Heywood shows the result of the islanding. This suggests that the islanding occurred sometime between 18:10 and 18:15 (NEM time).
Given that this is the first visibility to participants, it’s too early for market participants to have learnt of the islanding, to decide how they should respond, and adjust their bids (if Scheduled or Semi-Scheduled) to take advantage. What we can see happening are automated responses triggered as a result of the NEMDE run in the absence of any market participant response.
(A1) Auto-bidding at two batteries
The “$” symbols on the schematic signify that (from 18:15 to 18:20) there was some change in bid at Hornsdale Power Reserve (Generator and Load components) and also at Dalrymple North BESS (Load Component). We won’t go into the details – the main point is that these are independent of the trip.
Note that Lake Bonney is the 3rd battery in South Australia at present – however it does not feature during this particular event.
(A2) Three sets of DUIDs being Constrained Up/Down
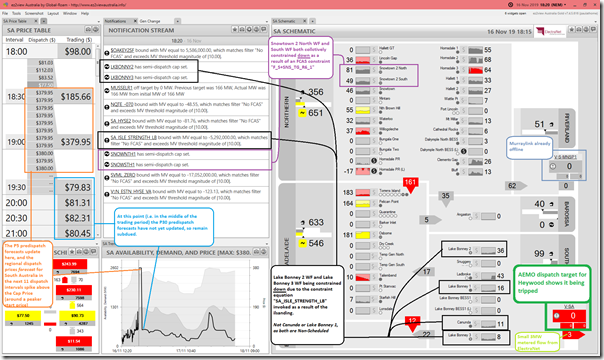
We see that four different constraints are bound affecting the output of four sets of generators – with two of these sets annotated on the image above:
(A2a) Lake Bonney 2 and Lake Bonney 3 (collectively) ‘constrained down’
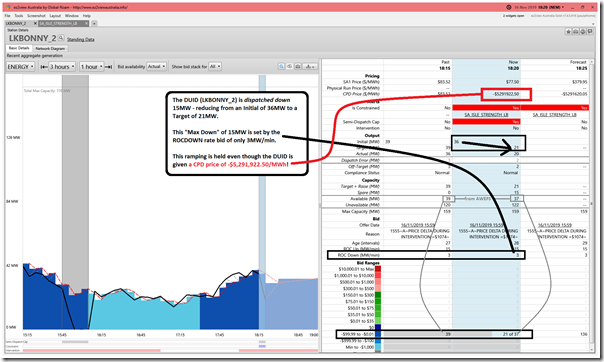
In the ‘Unit Dashboard’ Widget for the Lake Bonney 2 unit, we see that the constraint equation binding on Lake Bonney 2 really, really* wants to wind down the unit quickly to 0MW :
* We can see this in the Connection Point Dispatch price of –$5,291,922.50/MWh (yep, that far south!), which is obviously a long, long way under where they had offered their volume (in the bid range below $0/MWh but above –$100/MWh, which might be thought of as a ‘negative LGC’ bid notwithstanding this caveat).
However despite this strong desire for a fast ramp from the constraint equation, we see the ramp down limited to only 15MW because of the ROCDOWN rate bid in for the unit of 3MW/min.
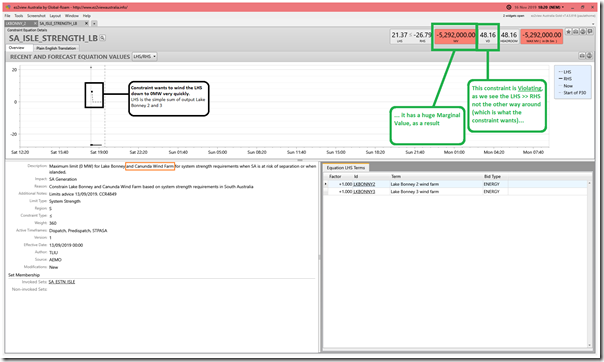
Out of curiosity we drill into the constraint ID “SA_ISLE_STRENGTH_LB” referenced here to see more:
Note that the constraint equation has already violated, because this constraint equation is saying that it would (in the absence of anything else) wind down the sum of the outputs to –26.79MW whereas the sum of the outputs
We noted that AEMO’s Description of the constraint suggests it also wants to wind down Canunda WF, but this is not possible in this dispatch interval as the unit is Non-Scheduled (just like Lake Bonney 1 WF). At some point in the past the unit was Scheduled, I believe, but this Description has not been updated when the registration status changed?
It’s a similar story at Lake Bonney 3, where the station was able to be would down to 0MW because of its low starting point.
(A2b) Snowtown 2 North and Snowtown 2 South (collectively) ‘constrained down’
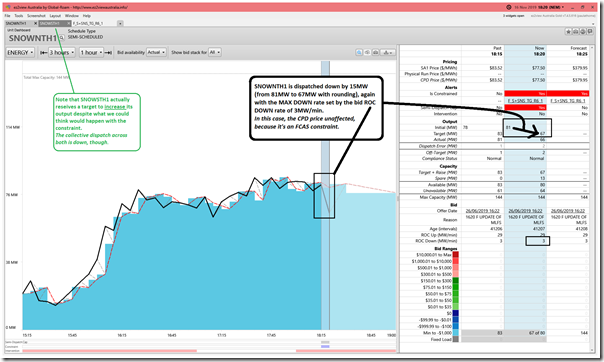
Here’s the Unit Dashboard widget specifically focused on SNOWNTH1 unit:
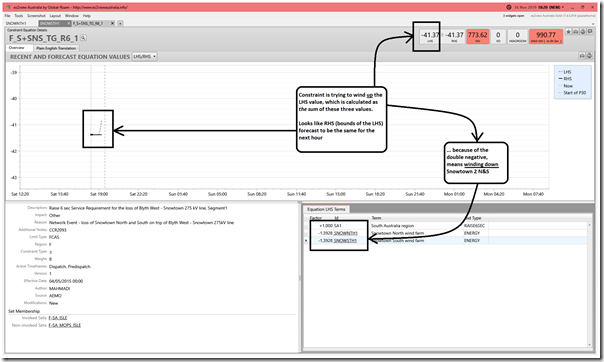
Similarly we look at the “F_S+SNS_TG_R6_1” constraint equation which is impacting on both North and South:
We see that the constraint is trying to keep 1.3928 times the sum of the outputs across two units (minus the Local Requirement for Raise Six-Second Contingency FCAS in SA) to be no more than 41.37MW, and in this dispatch interval there is an exact match (the constraint is bound, and has a non-zero marginal value).
Hence this constraint will cap the output of these 2 units, and even wind them down further if the local enablement of
(A2c) Osborne and Torrens B3 (separately) ‘constrained down’
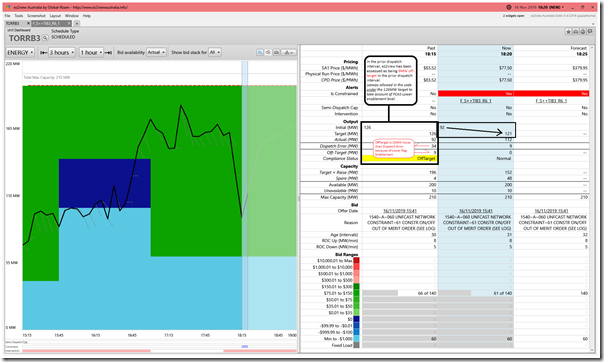
I did not have space to annotate this on the image above, but we can see the effect of the binding in the “-“ symbol replacing the normal unit filled circle for both units in the Adelaide zone. Here’s the Unit Dashboard widget for Torrens B3, for a start:
The display (above) for Torrens B3 is more complicated than those displays for the 2 wind farms above for several reasons (including the enablement for both Raise Regulation and Lower Regulation FCAS services coincident with their dispatch target). There are calculations running behind the scenes to derive some of the numbers shown but not all of these are transparent at this point.
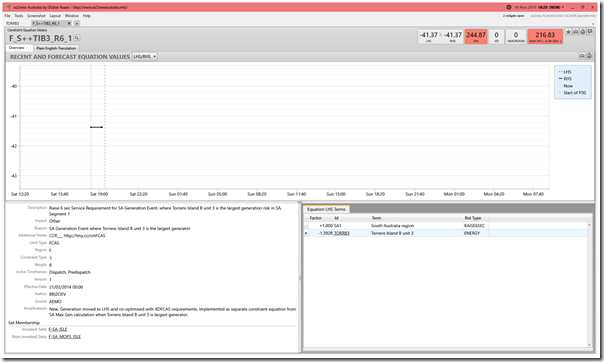
However the constraint equation that’s binding on TORRB3 is of a very similar form to that we explored for Snowtown 2 (North and South) above:
It is also having the effect of setting a limit on the output of TORRB3, subject to the RHS and the Raise 6second Local Requirement/Enablement in the islanded SA Region.
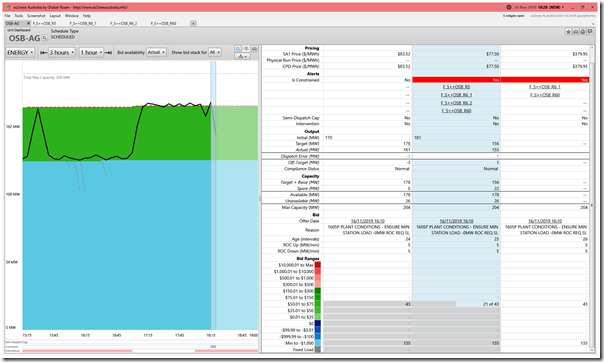
Finally, I have included the snapshot for Osborne CCGT plant here with no comment other than to note that this is being affected by four separate constraint equations, all FCAS (Raise) related:
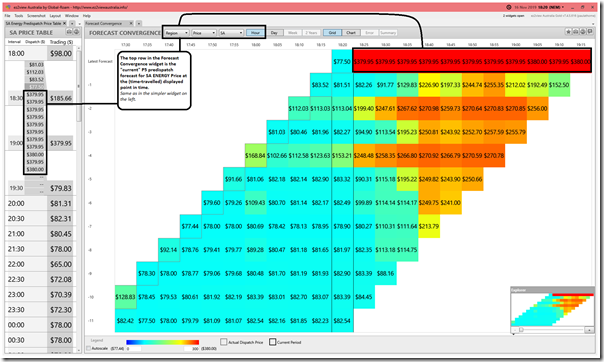
(A3) Forecast Dispatch Prices (for ENERGY) jump in the South Australian region.
As noted in the first image, we see that the P5 forecast prices for energy showed a forecast jump from the actual dispatch price for energy at 18:20. Delving deeper as enabled by the ‘Forecast Convergence’ Widget in ez2view, we see that this jump in price had been (somewhat) signalled over the prior 40 minutes or so – so perhaps was not wholly as a result of the interconnector coming offline?
i.e. look up a vertical to see how successive forecasts converged onto “actual” values in the top diagonal.
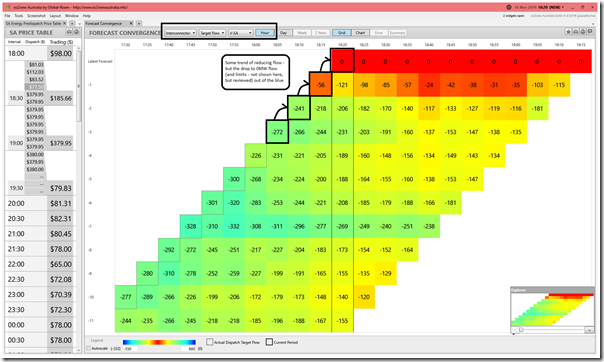
Out of curiosity, I flip the widget to show the Target Flow for the Heywood interconnector (and prior successive forecast for Target Flow) and we see that the flow east had dropped (from 18:10 to 18:15) but that the drop to 0MW was not forecast:
(A4) Prices for FCAS
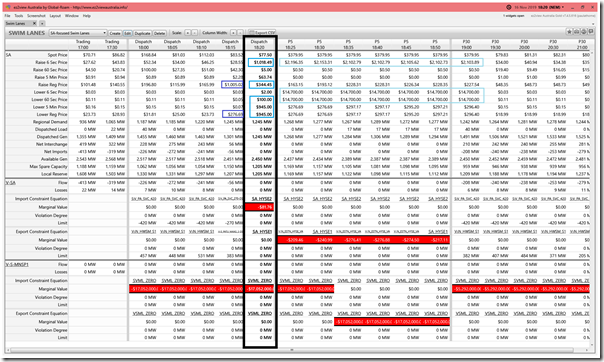
Finally for 18:20 we know this cursory initial review would not be complete if we did not also have a look at FCAS prices – there are enough clues in the constraint equations above that it would be remiss of us not to have a quick look:
For a change I have used the ‘Swim Lanes’ Widget in ez2view with a view specifically focused on SA Region Data and the Interconnectors.
To help those who are unfamiliar with this widget, I have highlighted the 18:20 dispatch interval, and in particular also some elevated prices for various FCAS services – with P5 predispatch forecasts suggesting this would continue (or get worse) into the near future.
(B) No manual Participant Responses at 18:25
Remembering that this was a Saturday evening, and that participants would have only had (approx) 3 minutes to digest all of the information available at the time and work out what to do, so it is hardly a surprise that there were no manual responses from participants taken account of at the AEMO in the NEMDE run published at 18:20:20 for 18:25
What was done at the two batteries (Hornsdale Power Reserve and Dalrymple BESS) was limited to what automated logic is able to manage.
(C) One new Participant Response at 18:30 (Snowtown 1 WF)
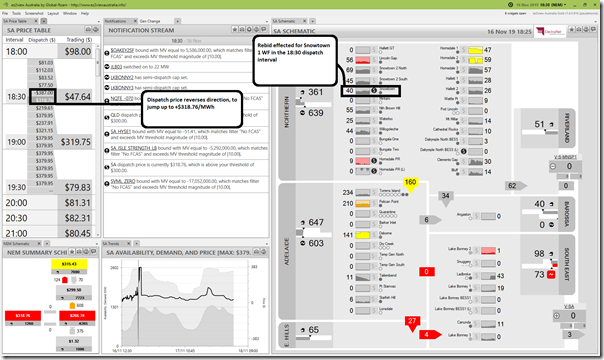
Stepping forward to 18:30 (a new title bar colour because of all the other windows still open) we see that there is a rebid response from the (older) Snowtown 1 WF (the first, apart from those at the 2 batteries):
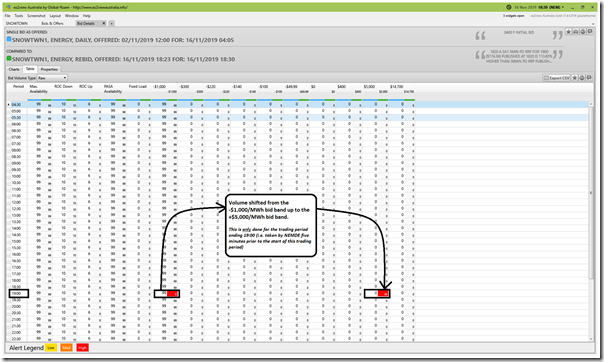
Using the Bid Comparison function (for this bid prior to the prior one) we see the logic has shifted volume from the –$1,000/MWh bid band up to $5,000/MWh (but note this only takes effect in the next dispatch interval (ending 18:35), so has no effect on the outcomes for this particular dispatch):
We do also flag that the dispatch price (for energy) has reversed the prior drop below $0/MWh.
(D) At 18:35 – many responses, and more information
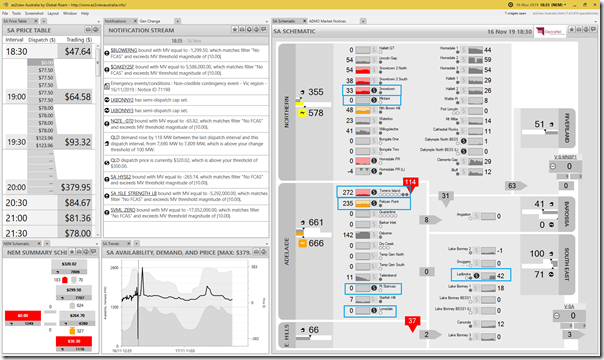
Five minutes later (and into the first dispatch interval of the new 19:00 trading period) we can see that there are many responses now received by the AEMO for use in the NEMDE dispatch run for 18:35 (new targets published at 18:30:20).
(D1) A quick review of the responses
We see in the image above (i.e. the ‘$’ symbols) for 18:35 that there are new changes in bids (i.e. from 18:30 dispatch interval to 18:35 dispatch interval) for the first time in this short review from Mintaro, Torrens, Pelican Point, Pt Stanvac, Lonsdale and Ladbroke Grove.
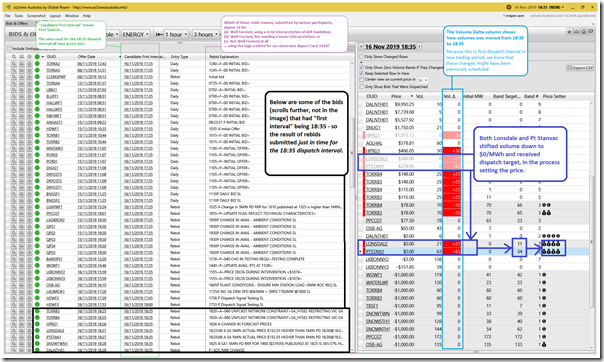
These changes could take a variety of different forms, so we open up the ‘Bids & Offers’ widget in order to have a quick look at both:
1) the changes that took effect between 18:30 and 18:35; along with
2) rebid reasons given.
As annotated on the image, it appears that the main mover was both Port Stanvac and Lonsdale peakers (both in the Snowy portfolio), who shifted volume down from above $300/MWh to $0/MWh in order to gain a dispatch target and begin operations.
As a result of this move, we see that these units were identified by the AEMO as being the primary contributors for setting the price for Energy in this dispatch interval. We won’t dwell on the details here, but worth noting that these bids for Energy also had an impact on the price for several FCAS commodities at the same time ( Raise6, Lower5 and LowerReg).
In the growing Glossary section of WattClarity, we’ve linked in several different contributions to explaining how dispatch works and how prices are set in the NEM.
I’ve also highlighted the various rebid reasons and asked the question about whether the bids matched the criteria set out in the AER’s Rebidding Guidelines to follow on from the algorithm we developed for use first in our Generator Report Card 2018.
Details about the AER’s Rebidding Guidelines, and how we use these in determining whether rebids are ‘Well Formed’, is also included in the Glossary here.
(D2) Don’t forget that FCAS (really) matters
A couple years ago now, guest author Jonathon Dyson penned an article titled “Let’s talk about FCAS” as a general wake-up call to us all – and that’s certainly what was the case yesterday evening!
With the Heywood interconnector tripped, all nine services (ENERGY + 8 x FCAS Services) needed to be procured from within the South Australian region.
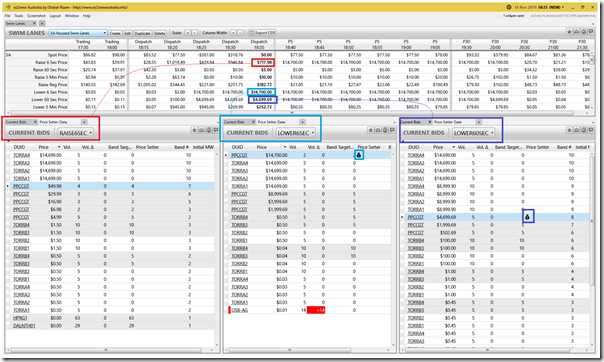
Here’s the ‘Swim Lanes’ view again, focused on 18:35 – but accompanied by 3 different views of ‘Current Bids’ – each of has been filtered to focus on three separate FCAS commodities which we see have spiked over the period since Heywood link tripped:
(D2a) Raise 6 Second Price at $717.98/MWh
We see the price first spiked at 18:20 and has remained elevated for the 4 dispatch intervals shown there (to date). A ‘Price Setter’ icon is not shown on the bids for Raise 6 second price – that’s because it’s the Energy Offer for Osborne that’s involved in setting this price.
Note here that there are bids at the bottom of the stack from both Hornsdale Power Reserve, and also from Dalrymple North BESS – being “raise” services, it makes sense that this is being discharge from the battery (i.e. acting like a generator).
(D2b) Lower 6 Second Price at $14,700/MWh
It took another dispatch interval (till 18:25) for this one to spike, but we see it lifting all the way to $14,700/MWh – with supply options just from Pelican Point, Torrens, and Osborne.
Note here that there no bids here from the batteries shown in this dispatch interval in the image above, though they did bid:
(i) Being “lower” services, it would be logical for this to be charging into the battery (i.e. acting like a load).
(ii) Because they are ‘the other side’ of a two-sided market, ez2view users need to toggle to show bids for loads (not generators) in the above – and I had forgotten to do this (thanks to the reader who – very quickly – alerted me to this!)
(D2c) Lower 60 Second Price at $4,699.69/MWh
Third in the series I’ve chosen to highlight was Lower 60 second FCAS – where the price rose in the 18:25 dispatch interval and was still at the same level for 18:30 and 18:35. We see here more bid bands shown with volume allocated – but still only the three thermal stations.
Same comment as above for the batteries (i.e. bidding as loads, not generators, in this case).
Understanding why some of the bid bands offered for each of these commodities was not dispatched requires delving into the details of NEMDE’s co-optimisation process, which we don’t have time to do today…
In the growing Glossary section of WattClarity, we’ve linked in several different contributions to explaining how dispatch works and how prices are set in the NEM.
(D3) The line trip was at 18:06 – earlier than assessed above.
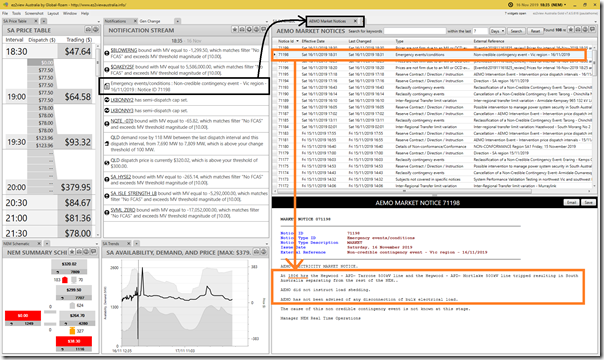
Note that there’s a Market Notice published at 18:31 (so only visible in the 18:35 dispatch interval) which tells us that the line actually tripped at 18:06, so maybe 5 minutes earlier than what I had assumed from the data shown above.
What did I miss, in this quick review of data at the time, that would have alerted me to the trip in the prior dispatch interval?
(E) Heywood returned by 23:10 (5 hours later)
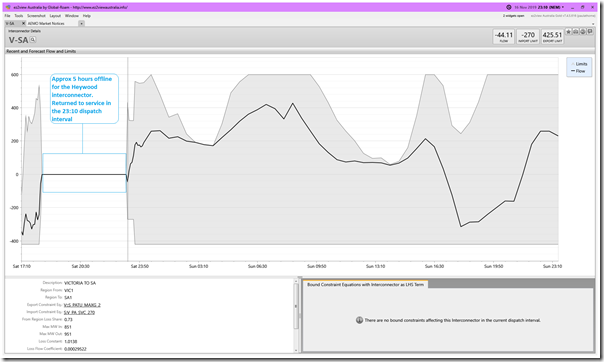
There’s more I could go on with here, but to wrap this up at this point I will just note that Heywood returned to service in the 23:10 dispatch interval, as shown here:
——————–
That’s all I have time for on a Sunday, as a first (but probably only) review – don’t forget to let me know what I have missed, or misunderstood!
——————–
(F) PS – various comments from others from Monday 18th November
The article was published on Sunday, and already we have seen a number of great questions and comments come in from others on social media (we only use Twitter and LinkedIn). So for reader’s benefits I have pulled them in here (and will update more, as time permits):
| Person who commented | Comment on social media |
| Allan O’Neil | On Twitter here, Allan O’Neil commented that:
That’s one implication I did not consider yesterday! |
| Josh Stabler | On LinkedIn here, Josh Stabler noted:
An interesting question, given where demand in South Australia is headed… Perhaps some of the boffins at the AEMO can help answer this? |
| Others? | As time permits (and if I remember) I will link in others |
Thanks for the input!


Looks like VIC gas picked up the missing 300 MW that was coming from SA at the time.
Plenty of gas on in SA as the solar disappeared and wind dropped off too.