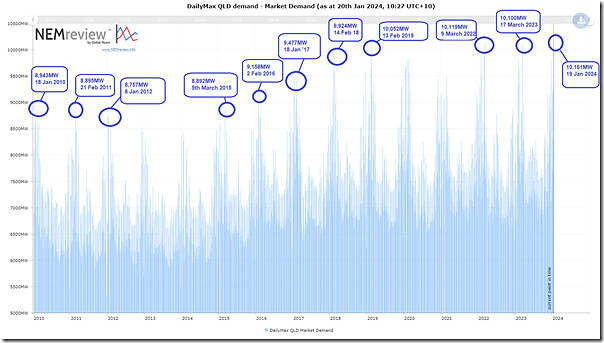
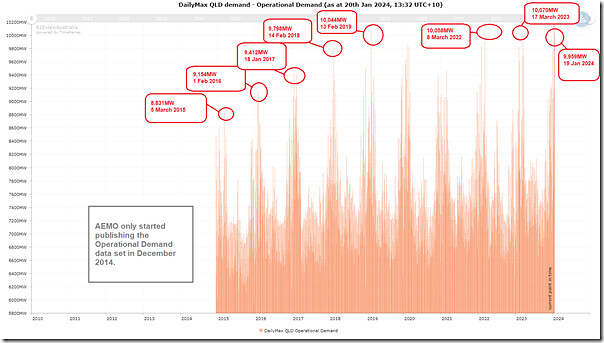
Following the heated demand activity in QLD on 30th Dec & 31st Dec 2023, and then on 18th January & 19th January 2024 (and looking forward to Monday 22nd January 2024) I thought it would be worth this short article to show a trend of daily maximum* demand in Queensland, using NEMreview v7.
* It’s been more common to write about the trend towards declining minimum demand.
Remembering the gory details of the different measures of demand, I’ll highlight the main two ones we speak about:
(A) Daily Maximum Market Demand
Firstly let’s look at ‘Market Demand’, because that’s what many market participants refer mostly to – as it relates most closely with NEMDE processes and dispatch outcomes (dispatch targets, prices, and so on …)
Those with a licence to the software can open their own copy of this NEMreview trend here.
Peak demand is clearly summer focused in Queensland. Over the longer term we can clearly see three phases in the trend:
1) From 2010 to ~2014 we see a trend of declining peak demand … due initially to these types of reasons, before the growing juggernaut of rooftop PV took over as the main reason in later years.
2) From 2015 to 2019 there was steady growth in peak demand … with a large deriver being the introduction of electric compression of upstream CSG to supply the Curtis Island export projects
3) From 2020 onwards there’s been a range of competing factors that means some years demand has increased, some years it has not. These factors include:
(a) COVID-19
(b) La Nina years
(c) Population growth, coupled with ongoing roll-out of airconditioning load.
(B) Daily Maximum Operational Demand
Next let’s look at ‘Operational Demand’, because that’s AEMO increasingly refers to as representing what they manage the grid to meet, from a ‘keeping the lights on’ perspective:
Those with a licence to the software can open their own copy of this NEMreview trend here.
Interestingly, in the chart above I have answered my own question from yesterday – Operational Demand seen on Friday 19th January 2024 was not a new all-time maximum. One might scratch their head to understand why the difference, but we’ll leave that for another day…
(C) Tabulated (selected) high points
I only highlighted some of the high points in the trends above – these are listed in the table below, linked to earlier articles for those who have an interest:
| Day | Peak demand event |
|---|---|
|
Tue 22nd Jan 2024 |
We’re not there yet … what will the peak demand be on this day (and will it be a new record)? |
|
Fri 19th Jan 2024 |
(a) A new record for ‘Market Demand’ peaked at 10,161MW at 17:30 … which was 42MW higher than the prior all-time maximum set on 17th March 2023. (b) But this was not the case for ‘Operational Demand’ |
|
17th March 2023 |
On 17th March 2023: (a) A high point for ‘Market Demand’ was 10,100MW … but this was not quite a new record. (b) ‘Operational Demand’ peaked at 10,070MW. |
|
8th March 2022 |
On 8th March 2022: (a) A high point for ‘Market Demand’ on this day (date typo on chart above) was 10,119MW … which was a new all-time record. (b) ‘Operational Demand’ peaked at 10,058MW. |
|
13th Feb 2019 |
On 13th Feb 2019: (a) A high point for ‘Market Demand’ was 10,052MW … which was a new all-time record. (b) ‘Operational Demand’ peaked at 10,044MW. |
|
14th Feb 2018 |
On 14th Feb 2018: (a) A high point for ‘Market Demand’ was 9,924 MW … which was a new all-time record. (b) ‘Operational Demand’ peaked at 9,798MW. |
|
18th Jan 2017 |
On 18th Jan 2017: (a) A high point for ‘Market Demand’ was 9,477 MW … which was a new all-time record. (b) ‘Operational Demand’ peaked at 9,412MW. |
|
1st Feb 2016 |
On 1st Feb 2016: (a) A high point for ‘Market Demand’ on this day (date typo on chart above) was 9,158 MW … which was a new all-time record. (b) ‘Operational Demand’ peaked at 9,154MW. |
|
5th March 2015 |
On 5th March 2015: (a) A high point for ‘Market Demand’ was 8,892 MW … which was highest for a number of years, but not an all-time record. (b) Note that ‘Operational Demand’ peaked at 8,831MW. |
|
8th Jan 2012 |
On 8th Jan 2012: (a) A high point for ‘Market Demand’ was 8,757 MW … which was highest that year, but not an all-time record.. (b) ‘Operational Demand’ was not measured. |
|
21st Feb 2011 |
On 21st Feb 2011: (a) A high point for ‘Market Demand’ was 8,895 MW … which was a new all-time record. (b) ‘Operational Demand’ was not measured. |
|
18th Jan 2010 |
On 18th Jan 2010: (a) A high point for ‘Market Demand’ was 8,943 MW … which was a new all-time record. (b) ‘Operational Demand’ was not measured. |
That’s all for now


Great info. I’d love to see an update on these charts with time of day for peak demand included.
Knowing what time of day the peak demand has occurred, from before rooftop solar was measurable to now, would give us a good idea of the real impact of rooftop solar on peak demand.