Well, that was a very hot and sweaty walk home from the office today.
Over the ~hour long walk, my phone was buzzing with plenty of SMS alerts (triggered in our ez2view software, but also accessible in some of our other tools) … and these are ongoing. So let’s briefly unpack a few things:
(A) New all-time maximum for demand in QLD
Perhaps most* notably is that the QLD demand briefly peaked above the previous all-time maximum.
* depends on a reader’s individual perspective
(A1) Measured as ‘Market Demand’?
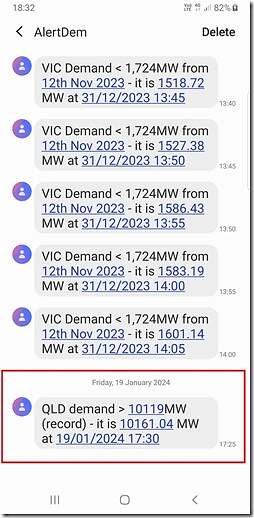
As captured in this SMS alert, the ‘Market Demand’ peaked up at 10,161MW in the 17:30 dispatch interval (NEM time).
As noted there, the demand peaked at 10,161MW at 17:30 … which was 42MW higher than the prior all-time maximum (which was ).
(A2) Landed ‘hotter’ than forecast
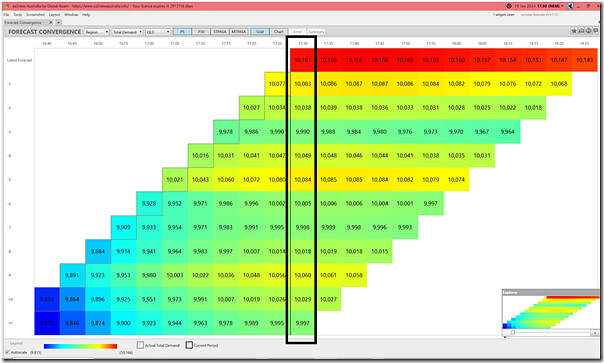
Using the ‘Forecast Convergence’ widget in ez2view and time-travelling back to 17:30, we see that (by ‘looking up a vertical’) the actual level of ‘Market Demand’ was well above what was forecast beforehand in the AEMO’s P5 Predispatch forecasts:
(A3) So what about ‘Operational Demand’?
Now frequent readers will remember there’s much gory details in relation to the various measures of demand – and that the AEMO increasingly uses an ‘Operational Demand’ measure because that relates to some of their ‘keeping the lights on’ challenges.
Time permitting in a subsequent article we might look more into what happened in terms of ‘Operational Demand’.
(B) Tight supply-demand balance
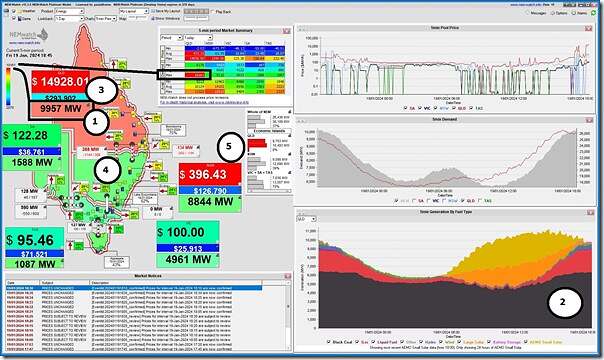
Here’s a snapshot of NEMwatch taken at 18:45, after I arrived home and after the new all-time max:
Notably:
1) ‘Market Demand’ is still well up in the ‘red zone’ … up at 9,957MW at this time
2) The supply mix has ramped up, in terms of supply from ‘Keeping the Lights on Services’ because:
(a) Solar’s close to bedtime by this time; and also
(b) Supply from the few wind farms in the QLD region was quite modest (aggregating to 140MW at the start of the 17:30 dispatch interval).
… remembering that we posted this snapshot of individual station outputs at 16:25, in a future article we might delve into more of the fuel supply mix.
3) Prices are elevated in QLD (at $14,928.01/MWh … well on the way to the Market Price Cap) … and also slightly up in NSW
4) In terms of the interconnectors:
(a) At least QNI is flowing north, but running at a limit of only 388MW north.
(b) Whereas Directlink is being constrained such that it must flow south.
5) Because of the constraints on both interconnectors, there’s a QLD-only ‘Economic Island’ formed, meaning it’s on its own for additional demand:
(a) The net demand being supplied in that ‘Economic Island’ is 9,703MW
… i.e. lower than the ‘Market Demand’ because some of it was being supplied in net terms from NSW (i.e. imports via QNI are larger than exports south via Directlink)
(b) This is being supplied from 10,493MW Available Generation;
(c) Leaving a local surplus of only 790MW;
(d) Or a very tight 8% IRPM (Instantaneous Reserve Plant Margin) for the ‘Economic Island’ … so well down into the red zone.
6) Not shown here, but there were Actual LOR1 conditions during some of this period.
There’s much more that could be noted … but we’ll leave that till later…
(C) Volatility
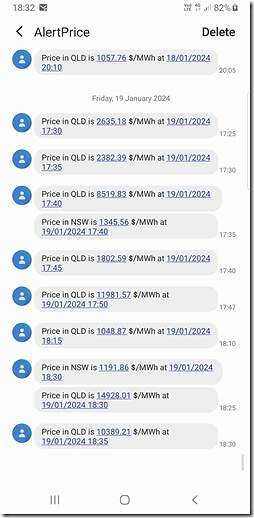
The NEMwatch snapshot shows some volatility for a single dispatch interval – here’s the initial run of SMS alerts today (before they continued to scroll off the screen:
(D) More to come, about today…
When time permits next week, we’ll dig into this in more detail.
(E) Stay tuned for Monday?!
A reminder at this point that it may well be that the new record is short lived, and is ratcheted higher still on Monday 22nd January 2024.


Leave a comment