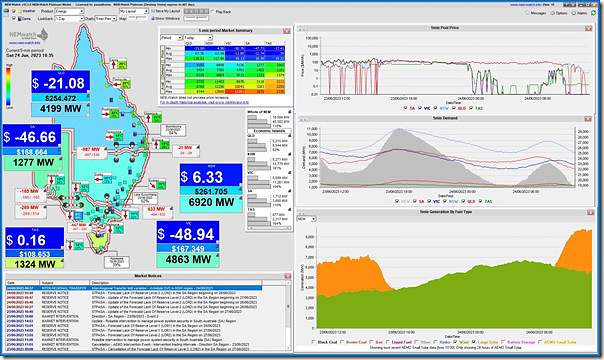
It’s mid-morning Saturday 24th June 2023 and aggregate production from Wind + Large Solar is approaching 10,000MW (much of this contributing to supply of only 18,584MW NEM-wide Market Demand). No surprise then that prices are subdued in all regions … and at, or approaching, ‘negative LGC’ in QLD, VIC and SA, as we see from this snapshot of NEMwatch at 10:35:
No doubt there’s a degree of economically-induced curtailment at some of the Semi-Scheduled Wind and Solar Farms in those negatively priced regions.
Another thing today means is that we’re fast approaching the end of Q2 2023 … which means we’ll shortly start cranking the handle on the detailed analysis for this quarter for the compilation of GenInsights Quarterly Updates for Q2 2023. One particular statistic I’m looking forward to delving more into the detail of will be with respect to curtailment of wind and solar.
Here on WattClarity, curtailment (or ‘spillage’) has been covered in numerous articles over the years, including:
1) A widely-read discussion in May 2023 by Tristan Edis, where he wrote ‘Australia’s Renewable Energy Boom – The Good, The Bad and the Downright Ugly’ with reference to our GSD2022 (which contains data to 31st December 2022); and
2) This was followed by Allan’s analysis a few days later in ‘Renewable curtailment – forced and not quite so forced’.
… those articles explained why there are several reasons (incl two big ones) why VRE might be curtailed.
It’s also worth reminding readers of the difficulties in estimating curtailment:
1) Marcelle discussed this in June 2020 in noting ‘Not as simple as it appears – estimating curtailment of renewable generation’.
2) In more recent years, the situation has become even trickier to ascertain, given the rising popularity amongst Wind and Solar operators to [INSERT PREFERRED VERB HERE*] … which gives rise to less credible estimations of ‘what could have otherwise been’.
* As noted before, different readers will choose different verbs here:
(a) Some will choose to describe this as ‘optimising their commercial position’
… which is (possibly) within the rules, but (probably) not ‘passing the pub test’
(b) Others might use a term such as ‘gaming the market’ …
Elsewhere, it’s been a focal point of discussion in many locations (including some recent Keynote Presentations at conferences recently). I thought it might be useful to publish more broadly here some of the analysis included for the previous quarter in the previous Quarterly Update (i.e. for Q1 2023) as follows:
(A) Long-range monthly trend
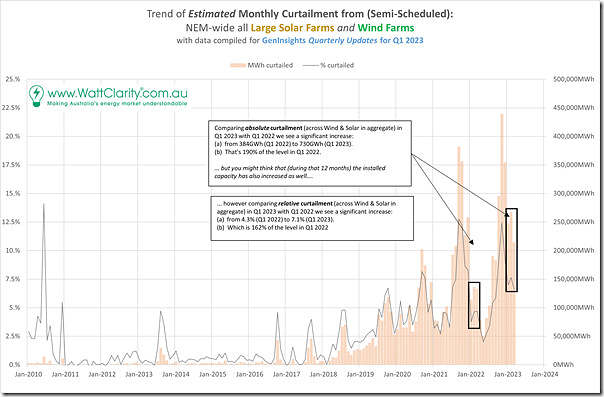
In the GenInsights Quarterly Updates for Q1 2023 we presented trended monthly calculations for (separately) Wind and Large Solar. Out of curiosity I’ve combined that analysis here and present results on a Wind + Large Solar basis back 13 years of NEM history.
As noted on the chart:
1) In absolute terms we see a significant increase over 12 months (i.e. Q1 2022 to Q1 2023):
(a) from 384GWh (Q1 2022) to 730GWh (Q1 2023).
(b) That’s 190% of the absolute level in Q1 2022.
2) Even in relative terms (i.e. somewhat normalising for growth in installed capacity) we see a significant increase:
(a) from 4.3% (across Q1 2022) to 7.1% (through the whole of Q1 2023).
(b) Which is 162% of the relative level in Q1 2022
A sign of challenges ahead … both at a macro perspective, but also in the case of specific project Business Cases, as Tristan noted?
(B) Daily stats through Q1 2023
In each Quarterly Update we invest time to dissect a range of different metrics down at a daily basis for the ~90 days that make up the focused quarter. Here are the results for Wind and Large Solar that were presented in the GenInsights Quarterly Updates for Q1 2023 :
(B1) Daily curtailment of Wind
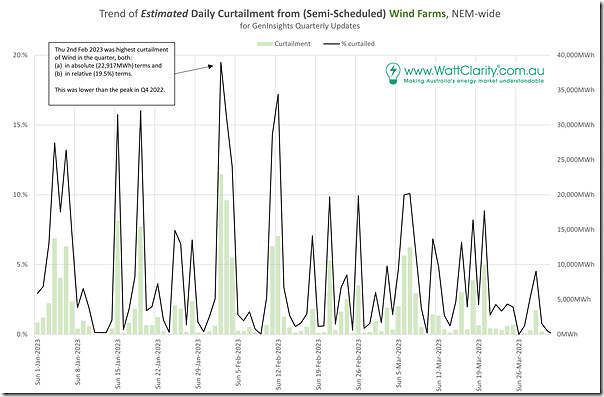
For Wind we see the curtailment on a daily basis is very up-and-down. Some days see not much curtailment at all whilst other days see curtailment almost reaching 20% as a daily NEM-wide aggregate across that day!
In the report we highlight some specific days – some of this is shared below.
(B2) Daily curtailment of Large Solar
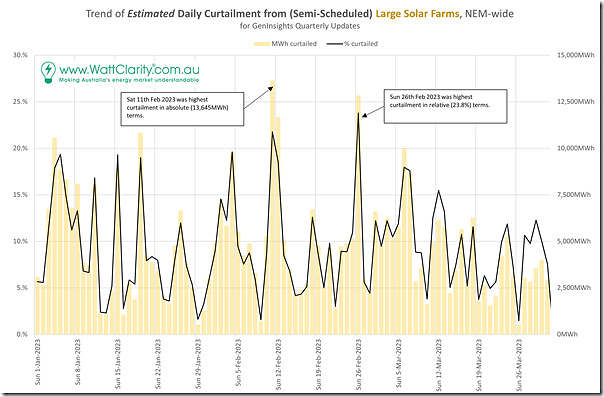
Here’s the same chart but for Large Solar across the NEM:
There’s not the same level of volatility in curtailment on a day-to-day basis with Solar as there is with Wind.
(B3) Noteworthy days
It’s worth flagging a couple particular days in Q1 2023 from the two charts above:
| Specific Days | Details |
|---|---|
|
Thu 2nd February 2023 |
This day saw highest wind curtailment – both: (a) in absolute (22,917MWh) terms and (b) in relative (19.5%) terms.At least in part as a result, this day also represented the highest aggregate (i.e. Wind + Large Solar) curtailment: (a) in absolute (30,003MWh) terms and (b) in relative (18.04%) terms. |
|
Thursday 9th February 2023 |
On this day curtailment of Wind (8MWh or 0.02%) and Solar (712MWh or 1.56%) were both low. In aggregate terms this represented a day with only 0.8% aggregate curtailment.
We previously noted that there was spot volatility and an Actual LOR1 in South Australia on this day. |
|
Saturday 11th February 2023 |
On this day curtailment of solar was highest in absolute (13,645MWh) terms.
In aggregate terms, Wind + Large Solar curtailment was high on this day |
|
Sunday 12th February 2023 |
Aggregate (Wind + Large Solar) was also high as well on this day: This was a hot Sunday afternoon in QLD where Market Demand reached 9,512MW. |
|
Sun 26th February 2023 |
On this day curtailment of solar was highest in relative (23.8%) terms |
|
Sunday 26th March 2023 |
On this day curtailment of Wind (0MWh) and Solar (531MWh or 1.46%) were both low. In aggregate terms this represented a day with only 0.68% aggregate curtailment. |
(B4) Curtailment of Rooftop PV
In GenInsights Quarterly Update we’re not delving into curtailment of rooftop PV – because:
(a) it’s not possible to discern how much is occurring; but also because
(b) it does not seem likely that it’s a large volume (relative to total production), at least at this point.
But as the example of November 2022 in South Australia showed, this does happen from time to time.


If a coal plant mothballs a unit for the shoulder season, is that considered curtailment?
If so, the MWh involved are potentially much more than wind and solar.
No, and that really isn’t happening yet. The shoulder season is typically when units are taken off line for maintenance.
It would be interesting to see on these days of very high curtailment if there was a corresponding restriction on one or more of the transmission links between regions such as QNI, VNI, Heywood or Basslink. It is relatively rare to have both excellent wind and solar conditions across all regions. Today was one of those exceptions.