I know I should be focused on other things (as noted earlier about GenInsights Quarterly Update report for Q4 2022, with a client Executive Briefing on Monday) but the distractions are overpowering:
Distraction #1) We’re sweltering in Brisbane and steaming towards what would be a shattering new all-time demand record for the QLD region (latest P30 predispatch shows the prediction for 10,656MW ‘Market Demand’ peak at 17:30 today
…. if this holds true, it will be well past the previous all-time record (10,119MW) from 8th March 2022.
Distraction #2) We recently reconfigured our office and the market activity today has prompted us to complete the process of getting all of our display screens up (some for looking at the NEM externally – using our software and other things – and some for monitoring the internal processes we use to serve our clients).
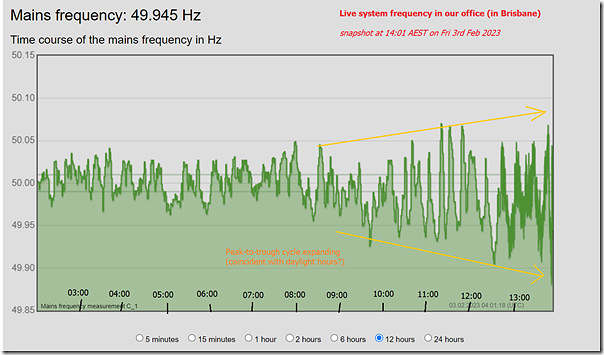
Anyway, we loaded a dashboard of our live and high-speed readings of System Frequency in our office, and something jumped out at me that I thought was worth sharing.
For those not so familiar with why System Frequency is important, there’s an explanation on this Glossary Page that explains frequency and FCAS.
Apologies that I’ve done a messy job in quickly annotating with approximate times and so on.
Q1) Is it just me, or do other readers see expanding peak-to-trough cycles in frequency as daylight hours ramp up?
Q2) If this is the case (and if it is systemic) …
(a) what share of this might be caused by (the variability in) solar injections
(b) … or is it related to some other form of supply or demand that is daylight related?
Q3) Is it also me, or do other readers see that the frequency is biased low (i.e. under 50Hz) more often than not during much of the daylight hours showing
(a) having asked that question, I recall that I’d looked before about the skew of frequency in the article ‘Observations of differences in system frequency in the Mainland NEM (comparing 2019 to 2021)’ of 14th May 2021.
(b) In that article I’d also seen the pattern whereby frequency from ~08:00 to ~12:00 was typically skewed low.
Q4) If that’s the case, what are the implications of it?
… remember that system frequency was mentioned in relation to the ‘Rise of the Machines’ … and also in Appendix 6 within GenInsights21.
Comments welcome on the patterns (potentially) noted above?
—
So having shared that, I’ll get back to the GenInsights Quarterly Update report for Q4 2022 … noting that it will cover system frequency patterns in Appendix 1.
—
PS conversation starting on LinkedIn
For what it’s worth, there’s a conversation starting on LinkedIn here about this article and the questions within it.


Hi Paul, you are right. This is obviously an expanding frequency oscillation although luckily it does not break the +/- 0.15Hz deviation. A few observations: 1) disturbance always exists in the system, but usually well damped. However, with the high load, the damping is often weak. The system does not look like well damped in this case especially around 13 o’clock. It would be interesting to see the voltage profile. Usually they are decoupled, but not in the case of weak damping. 2) The skew to the lower frequency indicates in average the load is increasing, thus although it happens in the mid of the day, the rooftop solar should not be scolded for this expanding oscillation. It is more likely that the disturbance from ramping up the outputs of the generators and even switching in some generators both introduce disturbances and can cause this oscillation. After the transients of ramping up the generation, the system should settle down with much smaller deviation. 3) The oscillation looks like has a period of 10-15minutes (say 4-5 cycles between 11am -12pm). Does that time scale also roughly conform to the time scale of ramping up the generation and the AGC? Highly likely. Anyway, thanks for sharing and it would be interesting to use these observations to validate the models used for system frequency studies, but of course hard as the non-transparency of the control model, which is fully understandable.
Jin – you may be interested in a deeper dive into this I posted here yesterday
https://wattclarity.com.au/articles/2023/02/investigating-last-fridays-frequent-frequency-swings/
Allan