Yesterday the AER released its Wholesale Markets Quarterly for Q2 2022.
At the time of the release of the AEMO’s QED for Q2 2022 (over 5 weeks ago), we invested some time to skim the report and noted that the AEMO QED highlighted at least Eight Factors contributing to extreme price outcomes in Q2 2022.
Given the intense (and quite logical) interest in the 2022 Energy Crisis in Australia (and also observing larger concerns in Europe, and with various parts of the North American grid currently facing its own supply-demand issues in the current heatwave) I thought it would be useful to invest a bit of time today to skim the AER’s reports to see what factors were identified in the report.
(A) The AER’s Key Insights
Let’s start by highlighting the key Insights that the AER flags here:
- Coal-fired generation was plagued by outages and supply problems. Wind and solar generation were lower than expected while demand was high due to cold winter conditions.
- Gas-powered generation, and some hydro, had to fill the gap, pushing up already elevated gas prices influenced by record international prices.
- Fuel prices and fuel availability emerged as a major issue for coal and gas generators, while hydro power stations were managing water levels and environmental concerns.
- Gas supply was tight with less offers into the southern markets to preserve storage for winter.
- The need to cover high fuel costs, or to ration fuel or water levels, caused participants to offer their capacity at progressively higher prices.
- Record prices triggered protective price caps, multiple market interventions, and a never-before-seen market suspension of the entire National Electricity Market.
- High fuel costs are likely to continue as international coal and gas prices remain at historical highs.
- Generation closures, including the impending closure of Liddell power station in April 2023, and tight gas supply conditions, with a domestic gas supply shortfall projected for winter 2023, means that market conditions will remain challenging for some time.
In this listing above I have highlighted a number of different factors that all combined to contribute to the extreme outcomes
(B) Discussion of individual factors…
So let’s quickly dive into the report to see what the AER says about each of these factors:
(B1) Three different factors related to coal
It’s important for readers to understand that these were really three separate factors that combined together to significantly impact on Q2 outcomes:
Factor #1) Higher coal-fired unit (and baseload gas) outage rate
In section 3.1 the AER highlights that:
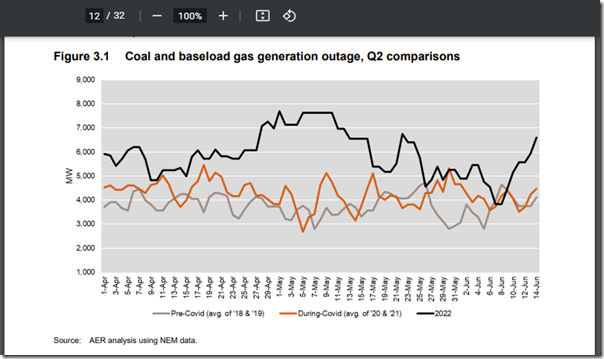
‘Over Q2, a high level of scheduled and unscheduled coal generation outages–and to a lesser extent gas baseload outages—contributed to the tight supply conditions across several regions.
A high level of unexpected outages restricts available generation capacity, making the market less able to respond to shocks. It also means that more expensive generation may be required to meet demand more often’
… and illustrated with Figure 3.1:
Factor #2) Coal pricing
The AER noted:
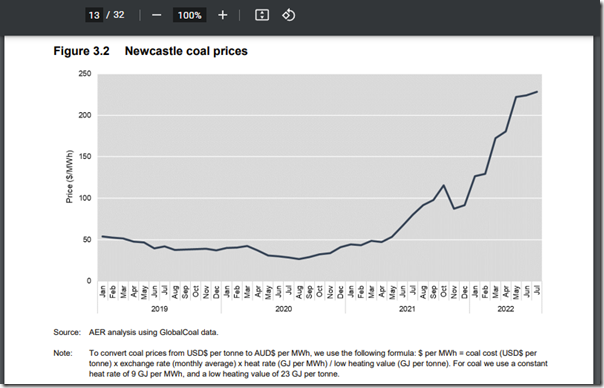
‘Figure 3.2 highlights that during the start of Covid and up to late 2020, the marginal cost to generate was below $50/MWh. However, as global economies emerged from Covid lockdowns, the demand for coal and the associated price has increased significantly. By June, the marginal cost to generate was above $225/MWh. This highlights that generators that need to source spot coal now require very high prices to generate’
with respect to this trend:
Factor #3) Coal supply constraints
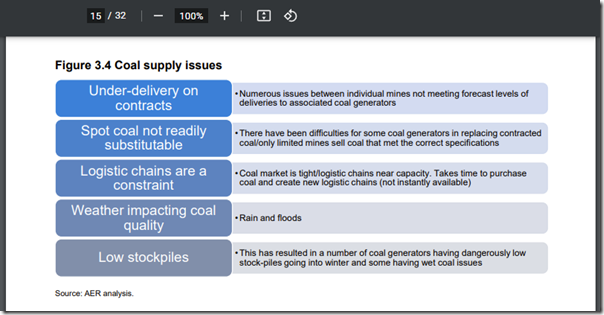
In section 3.3.1 (from p15/32) the AER writes about ‘coal supply issues’ and highlights ‘a number of issues that arose resulting in issues with coal supply and ultimately coal stockpile’:
Note that these could really be (each) separated out into their own separate factors, as they are quite different in nature – however the net effect was collectively all the same, in compounding the factors above and below to make supply-demand particularly precarious.
For those not so familiar with coal, but used to reading just the headlines, these two paragraphs are useful as background:
‘Most coal generators operate coal stockpiles which allows for short term shocks to supply (such as wet season flooding) and for periods where generation demand may be particularly high and the logistics chain is unable to meet demand (for example across peak periods over summer and winter).
Due to the high outages in April, some individual plants operated at higher levels than anticipated. Coupled with supply distributions due to weather and technical issues with individual coal mines, stockpiles at some plants became dangerously low. ’
… they also serve as a reminder to me about why we wrote in GenInsights21 about the emerging challenges of ‘the rise of Just in Time’ – as this is surely just an illustration of how tricky balancing supply and demand is going to become in future…
(B2) Two different factors related to gas
Once again, thinking of these just as ‘gas issues’ short-changes a real understanding that could help to inform the design of this ongoing energy transition:
Factor #4) Availability of gas for Gas Power Generation
In section 3.3.2 the AER writes about ‘LNG export pressure’ as follows:
‘When domestic prices are higher than international prices, LNG producers should face greater incentives to sell into the domestic market and drive the domestic price down. It is not clear that this occurred in May to June 2022.
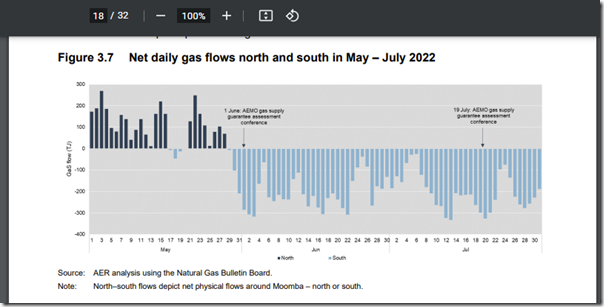
In fact, the opposite occurred with gas flowing north in May (Figure 3.7) to supply strong LNG exports from Gladstone in May and June 2022 (Figure 3.6). However, it may be the case that LNG producers committed to selling their available gas for export prior to May and could not supply to the domestic market despite the incentive of high prices. LNG producers maintained export volumes at a similar level to 2021 despite much higher domestic prices. This year, 30 cargoes of LNG were exported in May 2022 compared to 28 in 2021 and 26 in 2020.’
… and again:
‘AEMO has intervened in the gas market on two occasions, which has seen an increase in gas flows south (Figure 3.7). Increased flows south occurred from 1 June after AEMO called a Gas Supply Guarantee assessment conference. This event was triggered by low reserve conditions in the NEM and gas generators running on liquid fuel due to a lack of supply. Following AEMO intervention LNG exporters committed to offer gas to participants needing gas in the south. Even without a Gas Supply Guarantee event, there were already pricing incentives in May (due to domestic prices being higher than international prices) for LNG exporters to bring gas south.
AEMO called another Gas Supply Guarantee assessment conference on 19 July which saw increased gas flows south in the couple of days after the event. LNG exporters again offered gas into the domestic market for participants to bring south.’
… with this being Fig 3.7:
Factor #5) High gas prices
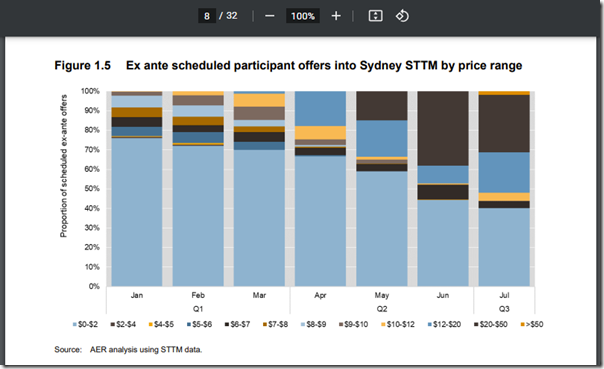
The AER includes (via their Fig 1.5) an illustration of the changed pricing of gas offers into the Sydney STTM hub:
Whilst pricing was increasing from as early as February 2022, the significant marked changes were not seen till April 2022 and further into Q2.
(B3) Three different factors related to renewables
Despite what you might read in various other places (e.g. which might focus just on the shortcomings of coal and gas through Q2) renewables also faced a number of their own issues, as well:
Factor #6) Solar production lower than expected
In section 3.4.1 the AER talks about how output from solar was lower than expected:
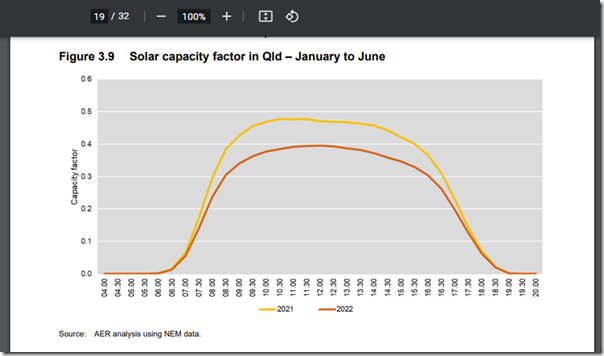
‘… despite an increase in installed large scale solar capacity of around 1,000 MW Queensland, actual output in 2022 was similar to 2021. Figure 3.9 compares the solar capacity factor for Queensland in 2021 and 2022 from January to June. ’
Here’s Fig 3.9:
… and continues:
‘Figure 3.9 clearly illustrates that on average, there was less solar electricity generated per MW of capacity in 2022 than 2021. This pattern is consistent with impacts in other regions. This not only impacts large scale solar generation but also rooftop solar generation (effectively increasing demand).
This resulted in other generators needing to operate at higher levels than anticipated to meet demand.’
This occurred due to the La Nina weather conditions.
PS … readers here might like to note that Giles Parkinson has written these criticisms of the AER’s analysis on this point. Trying to work out the extent of what actually happened through Q2 2022 in terms of solar is something we might return to later.
Factor #7) Wind production lower than expected
Additional to the poor performance of the fleet of solar farms across the NEM, the performance of wind was also disappointing (with respect to expectations):
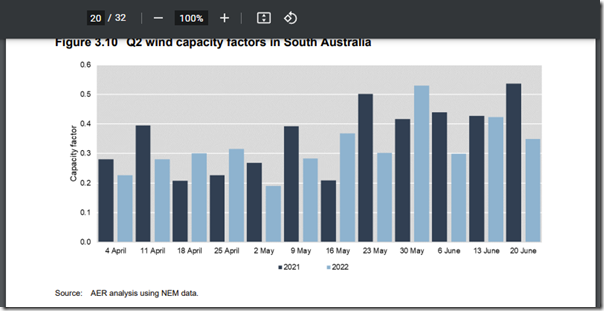
‘There was a similar trend for wind as for solar. Figure 3.10 compares the varying capacity factor for SA’s wind generation from April to June for 2021 and 2022 at a weekly level.
While wind output levels vary markedly from week to week, average output from wind in SA was down for two-thirds of the weeks of the quarter. Wind levels were particularly low in the week leading up to market suspension. In weeks where wind is low, other generators need to operate at higher levels to meet demand.’
Here’s Figure 3.10:
PS … readers here might like to note that Giles Parkinson has written these criticisms of the AER’s analysis on this point. Trying to work out the extent of what actually happened through Q2 2022 in terms of wind is something we might return to later.
Factor #8) Hydro water levels and environmental concerns
In section 5.3 the AER notes that ‘hydro generation has run harder but faced environmental constraints’ – continuing:
‘A participant reported record hydro generation this quarter while trying to balance storage levels for later in the year. They also faced environmental constraints that limited generation output. During periods of high flows and flooding, there were restrictions on the ability to release water from certain dams, to help reduce flooding downstream.
When hydro increases generation above what’s planned their ability to generate later in the year may be restricted. This explains why a hydro generator’s offers into the market will be closely linked to the offers of other generators. When the offers of coal or gas generators increase, hydro generators must also increase their offers or else they run the risk of depleting their water reserves for peak periods. ’
(B4) Supply-side (e.g. bidding) behaviours
It’s worth noting that the AER writes in the Executive Summary (p4/32) that:
‘This offer behaviour generally appeared to reflect these underlying market dynamics, however we are still undertaking analysis of participant behaviour’
… hence my reading is that it’s too early to factually state that existed as a separate factor contributing to the Q2 outcomes.
(B5) Consumption-side factors
Of course, all of the above speaks to supply-side factors – and it’s important we don’t forget about the demand side as the important ‘other half’ of the energy equation.
Factor #9) Demand was high
In the headline results, the AER mentions high demand due to colder weather – and in the Executive Summary (p4/32) they write that:
… ‘and a very early start to winter created higher than expected demand.’
However there’s not much further discussion in this report.
(B6) Network factors
Interestingly the AER does not (in what I saw) flag any network-related factors … but some were flagged in the QED.
Even if it turns out the AER omitted discussion about network factors it does not mean that the AER report is ‘wrong’ in any way … just that:
1) there were many different factors all conspiring to deliver the calamitous outcomes seen through Q2 in the NEM;
2) readers should just read what the AER has written (and the AEMO here, and us in articles collated under ‘2022 Energy Crisis’) as only covering some of these factors.
(C) Outcomes were unanticipated …
In our review of Q2 pricing patterns from 6th July we noted (see ‘B5’) we had no time to include a review of futures pricing patterns:
1) We expected to see that it would show the price volatility was unexpected (at least in terms of its extreme severity);
2) Using a pattern we had created for prior Q2 periods … such as Q2 2021 here.
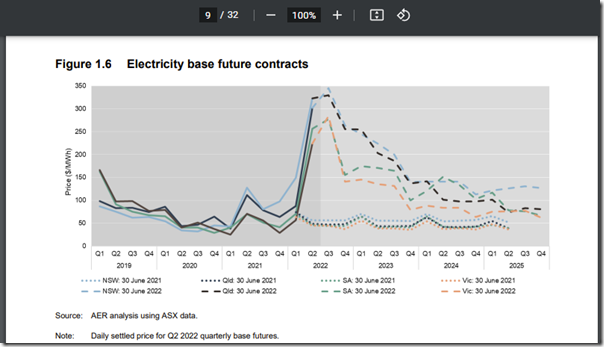
So it’s nice to see that the AER completed similar analysis in section 1.4 to note that the ‘futures market suggests these high prices were unanticipated, and will persist’… including this image of the forward curve to reinforce both points:
(D) A reminder, from GenInsight21
In this note to follow the QED I concluded with a reminder of what we wrote in the Executive Summary of GenInsights21 that…
‘As we worked through these questions via GenInsights21, several key data points led to the identification of three key challenges at hand:
1) Variability and Uncertainty are Increasing
2) Risks are Increasing
3) Complexity is Increasing’
… with what we saw emerge through Q2 – as highlighted in these (at least) 9 factors identified by the AER – being an example of this new environment that’s increasingly emerging.
Would be worth you reading AER’s Wholesale Markets Quarterly for Q2 2022 yourself!


Leave a comment