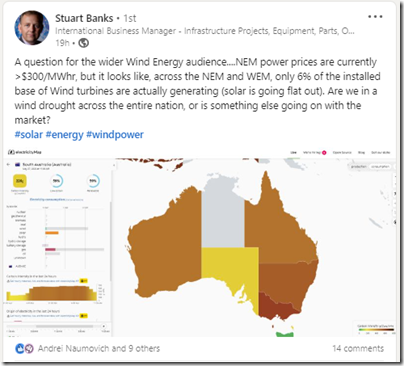
On LinkedIn yesterday, Stuart Banks asked a question about the low wind conditions he was seeing across the whole of Australia in the middle of the day:
This question sparked a bit of interest (worth reading the comments on the thread), so I made a mental note to have a quick look later.
(A) About ‘Wind droughts’
It was back in June 2017 when I asked the question ‘where’s the wind gone?’ at the end of a month that showed a surprisingly low level of wind harvest – it turned out back then that:
1) the Southern Annular Mode (SAM) was contributing to what happened through that month; and
2) my understanding is that I wasn’t the only person surprised by the depths and duration of what had happened!
For me, that incident sparked a more general series of questions about how frequent, widespread, deep and long-lasting these types of events might be as we move into a future more heavily dependent on wind generation.
—
These types of questions were keen focus for us when we completed the analysis (with help from Stephen Wilson and other collaborators) documented in Appendix 27 of GenInsights21. For more details of some of what we found, and describe in that Appendix, see this presentation for Smart Energy Council audience (at the ~ 0:40:28 minute mark)
—
Hence, as I noted in response to Stuart’s question, it’s now not a surprise to us that these types of things happen from time to time:
1) It’s quite frequent that the wind might dissipate NEM-wide for a couple of days at a time;
2) Less frequent (but more concerning) are the types of multi-week events such as we saw in June 2017
(a) and which we now understand could even be more severe, and widespread, in the future!
(b) what’s particularly concerning a number of people is the risk that these (long, low-wind) events might coincide with periods of (dull cloudy) low-solar days … the dreaded ‘Dunkelflaute‘.
(B) Wind production through May 2021 … to date
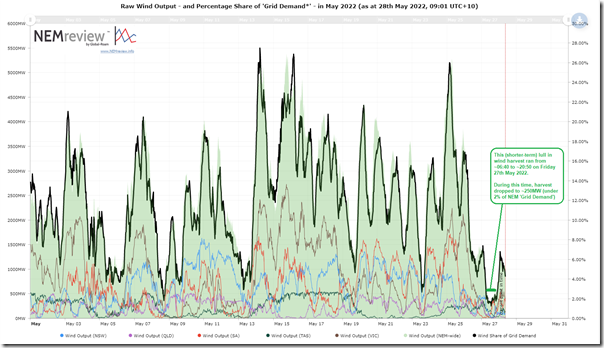
It’s Saturday morning and curiosity got the better of me, so I updated this trend query using NEMreview v7 to have a look at the trend of wind harvest through the month of May 2021 to this point:
In this trend we can see that it was only a shorter-term lull in the wind (there’s already been somewhat of a recovery through Friday night), though nowhere near ‘full throttle’ yet.
As noted on the chart, yesterday this lull in the wind:
1) Began before the (close-to-winter) morning ramp-up in solar production; and
2) Lasted several hours after the solar production had reached its (earlier-in-winter) bedtime.
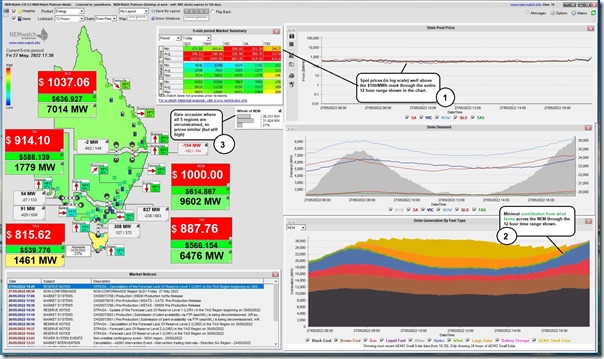
Hence it was not a surprise to see the evening prices yesterday gain an extra boost with the absence of wind production just one more factor exerting upward pressure on prices – as shown here in this snapshot taken from NEMwatch on Friday at 17:30 with prices around $1,000/MWh in all regions:
With respect to the numbered annotations on the image:
1) Prices were well above $100/MWh for the 12-hour time range across all regions; and
2) An added reason for this was the minimal production from wind over this period (other reasons discussed in other recent articles).
3) The 17:30 dispatch interval is particularly noteworthy because of:
(a) The unconstrained nature of interconnections between all regions (i.e. the absence of any ‘Economic Islands’ that inhibit price reductions through resource sharing);
(b) Yet even in spite of this unconstrained nature, the elevated prices across all regions;
(c) With the lull in the wind (still experienced at that time) overlapping with the end of solar production at the end of the day.
It’s only a week since last Saturday’s Federal Election, and the NEM’s throwing up reminders of the types of challenges that will need to be navigated if PM Albanese is going to deliver on his promise to ‘end the climate wars’ whilst also keeping a keen focus on electricity prices and security of supply.


Drawing an arbitrary line at 10% of installed capacity for wind drought, it has been barely more than that all day.
Still the message from the wind records is clear, the retirement of conventional power has gone as far as it can until grid-scale storage is on deck, on time and on budget, as you signalled years ago. Still waiting:)
RE can displace coal power but not replace it. https://www.riteon.org.au/netzero-casualties/#217
South Australia has demonstrated the point, they import power whenever the wind is low, never mind full-on droughts like yesterday. Currently they are importing and 70% of local generation is gas.
The NewWatch widget is the clearest indicator, a glance in the morning and evening is enough to see the unreality of the green dream. Not to mention the way things have gone in Britain and Germany.
Who is going to tell Albo and Chris Bowen:)
Apologies that this is somewhat off the exact topic yet still on vital subject of wind generation.
Wind generation plateau for 4 years in South Australia
http://www.warwickhughes.com/blog/?p=6921
What has caused wind generation percentage to plateau for 2018, 2019, 2020, 2021 in South Australia?
Aggregate wind production in South Australia has been limited (i.e. ‘constrained down’) due to various forms of the ‘System Strength’ constraint in recent years, Wazz.
Recently Marcelle provided this illustration of how the pain is shared around when constraints like this bind:
https://wattclarity.com.au/articles/2022/05/who-gets-to-run-when-everyone-bids-the-same-a-crash-course-in-disorderly-bidding-and-tie-breaking/
… and Allan previously wrote about how the syncons partially alleviate this issue:
https://wattclarity.com.au/articles/2021/02/new-sources-of-strength/
More articles on system strength are tagged here:
https://wattclarity.com.au/articles/tag/system-strength/
Hope this helps
Thanks for explaining that Paul – I tried searching the subject at various search engines but got nowhere. I must have been using the wrong words. I wonder what the implications are for this in other States and further down the path to “Net-Zero by 2050”