This is Article 3/3 this evening, and follows both:
Article 1/3) … which spoke to the new all-time record for electricity demand set in QLD this evening).
Article 2/3) … which spoke to the run of price volatility that spanned the period when ‘Market Demand’ and ‘Operational Demand’ were high.
In this article (and apologies for any mistakes, as it is early Wednesday morning!), we take a look specifically at the tightness of the supply-demand balance that coincided with the high level of demand and drove the extremes in pricing.
(A) Very low IRPM
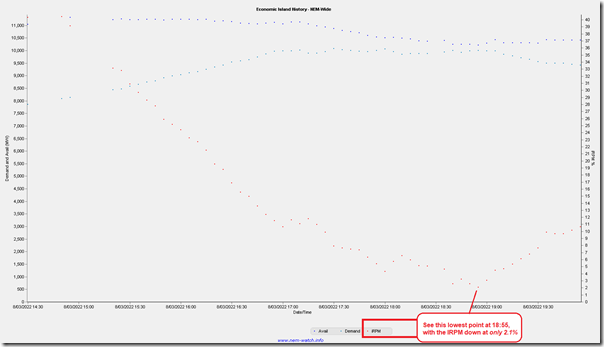
In the NEMwatch snapshot from 17:30 included in both Article 1/3 and Article 2/3 we see that the Instantaneous Reserve Plant Margin (IRPM) for the QLD-only Economic Island created by the constraints on the QNI interconnector.
At that time, the level was only 8% … but the story progressively became worse as we progressed further into the evening, with an amazingly low point reached at 18:55 … at which point the IRPM was a miniscule 2.1%. We can see this in the trend of the IRPM shown in a chart generated within the NEMwatch application here:
Note that this metric does not exist for every single dispatch interval … the QLD only ‘Economic Island’ disappears when QNI unbinds.
Note that the 18:55 dispatch interval:
1) Was one of the dispatch intervals highlighted in Article 2/3 as being at the Market Price Cap … understandably, with supply/demand so tight!
2) It featured Available Generation at 10,211MW.
3) Is shown in Article 1/3 of having Market Demand of 10,111MW … so barely below the new all-time-record.
4) Because of small (110MW) net import from NSW at this dispatch interval, this meant Net Market Demand of 10,001MW.
5) Which means a bare 210MW of ‘Surplus Generation’ within QLD to meet any contingency at any price!
(B) AEMO issued ‘Actual LOR2’ alert
It’s no surprise, therefore, to see that this was in the midst of the ‘Actual LOR2’ event that the AEMO announced for this evening in QLD.
This was announced at 17:43 in Market Notice 95166, and commenced from 17:30:
——————————————————————-
MARKET NOTICE
——————————————————————-
From : AEMO
To : NEMITWEB1
Creation Date : 08/03/2022 17:43:22
——————————————————————-
Notice ID : 95166
Notice Type ID : RESERVE NOTICE
Notice Type Description : LRC/LOR1/LOR2/LOR3
Issue Date : 08/03/2022
External Reference : Actual Lack Of Reserve Level 2 (LOR2) in the QLD Region on 08/03/2022
——————————————————————-
Reason :
AEMO ELECTRICITY MARKET NOTICE
Actual Lack Of Reserve Level 2 (LOR2) in the QLD region – 08/03/2022
An Actual LOR2 condition has been declared under clause 4.8.4(b) of the National Electricity Rules for the QLD region from 1730 hrs.
The Actual LOR2 condition is forecast to exist until 1900 hrs.
The forecast capacity reserve requirement is 443 MW.
The minimum capacity reserve available is 314 MW.
AEMO is seeking an immediate market response.
An insufficient market response may require AEMO to implement an AEMO intervention event.
Manager NEM Real Time Operations
——————————————————————-
END OF REPORT
——————————————————————-
Note that the minimum capacity reserve was forecast to be 314MW … but (by our numbers above) looks to have been only two-thirds of that amount!
This LOR2 event was cancelled at 19:30 and notified in Market Notice 95169 published 19:32.
(C) A quick look at the supply stack at 18:55
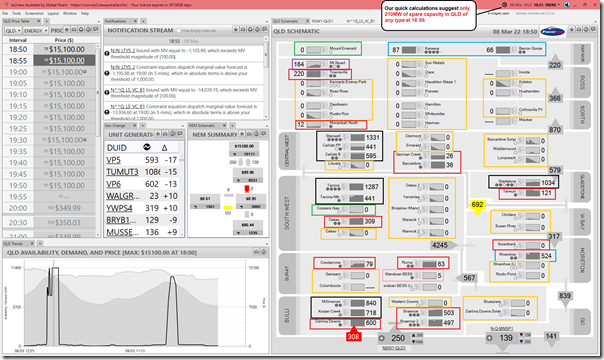
I’m running out of time tonight (as we tick into Wednesday morning!) so will just leave with this Time-Travelled view of an ez2view dashboard, and (remembering the schematics show ‘FinalMW’ values for end-of-interval output during Time Travel) a few very quick notes‘
Some quick notes…
(C1) Summary of Supply-Side Resources…
I’ve quickly coloured the stations by Fuel Type to make it clearer (so perhaps a mistake or two)… but this could be used to help focus the discussions below:
(C1a) QLD coal units
Remember that the Callide C4 unit is offline for many months yet.
Factoring in this, it seems that most coal units are running at close to maximum output – with the exception of Gladstone station, which has two units not running at all.
(C1b) QLD gas units
The big standout here is the absence of the Swanbank E unit.
Apart from this unit, there could be (relative to MaxCap) a small amount of additional capacity available at Condamine and Roma.
Note that Moranbah North and German Creek are both Non-Scheduled, so does not factor into the supply/demand balance calculation.
(C1c) QLD liquid units
Mt Stuart is liquid fuelled, and is a 3-unit station. However one unit appears to be offline at this point in time.
(C1d) QLD hydro units
All 8 x hydro units at Wivenhoe, Barron Gorge and Kareeya are running flat out.
(C1e) QLD large solar units
Aggregate output is 0MW.
This is not a surprise, given that it was 18:55 at this time … but still something that illustrates one of the underlying challenges of this energy transition (i.e. the peak in Market Demand this evening persisted much longer into the evening than Large Solar was able to contribute anything).
(C1f) QLD wind units
Aggregate output is 0MW.
This is a surprise to me – whilst it’s reasonably common to experience relatively low wind output at times of high temperatures (and hence demand), I did not expect to see output being absolute ZERO.
With the two existing wind farms (Coopers Gap and Mt Emerald) perhaps 1,000km apart, it does surprise me to see them both at 0MW:
1) A real-world (and very critical) example of ‘Dunkelflaute’?
2) I’ll will wait for more data tomorrow to see if there might be some other contributing factors!
(C1g) QLD single BESS
The output from this single unit was only 5MW … however I suspect that this small output was because of commissioning-related limitations.
So in summary, we’re hurt by:
-
- missing Callide C4,
- missing Swanbank E,
- missing 3 other units which appear to be out (Gladstone 1 & 4, and Mt Stuart 2)
- absolute ZERO from Large Solar across the state
- absolute ZERO from Wind across the state
- low output from the Battery (which we believe is still in commissioning?)
Signs of the times, in terms of challenges for the supply-demand balance, for this energy transition?
(C2) Imports from NSW
It’s worth noting that the ‘N^^Q_LS_VC_B1’ constraint equation is one of the ‘Kogan constraints’, and is limiting flow north on QNI and Directlink* to ‘avoid voltage collapse on loss of Kogan Creek’.
* technically, this constraint equation is limiting flow north on Directlink so severely that is it making flows run south over DLINK to the tune of almost 140MW south … at a time when the QLD supply-demand balance is very, very tight!


Leave a comment