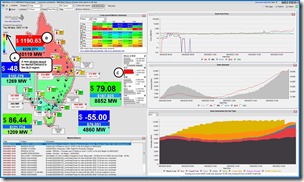
This is Article 2/3 this evening, and follows Article 1/3 (which spoke to the new all-time record for electricity demand set in QLD this evening).
In this article, I’d specifically like to highlight a long run of extreme prices in QLD (i.e. above $1,000/MWh)
1) The pricing run began at 17:30 with the price at $1,190.63/MWh as shown in this snapshot from NEMwatch that was also shown in Article 1/3 because of the new all-time-record in
I’ve deliberately made this image smaller here as it’s not the focus … though you can click to open a larger size.
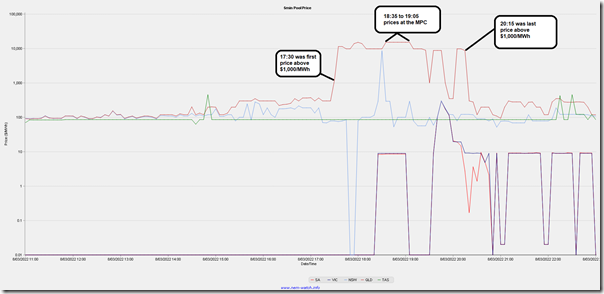
2) What’s more important is the longer run of volatility seen in this chart from NEMwatch later looking backwards.
3) We see that the run of extreme volatility lasted until the 20:15 (i.e. almost 3 hours later), where the price (at $8,679.33/MWh) was the last of the prices >$1,000/MWh.
4) In between the period, there were a number of prices at the $15,100/MWh Market Price Cap
5) Even prior to this time, prices had been around or above the $300/MWh cap trigger price for a number of hours.
As a result of all of this, the Cumulative Price for the QLD region has climbed to above $564,000 … so just under half way to the new Cumulative Price Threshold in the post Five Minute Settlement environment.


What happened to the interconnectors during this period?
They didn’t even average 10% of their capacity. Given there was fore warning about these conditions, how was it possible that they were not brought back online? I can only assume it was to do with the floods, but that is a worrying sign as flooding events are going to become more frequent and more extreme.
Unfortunately there was almost no wind based generation during this period. I haven’t checked for constraints, so I assume it was just that the conditions weren’t suitable. This is going to make solving this sort of event very hard in a near 100% RE grid. It is going to take many levers to solve this sort of event, more demand management, much more energy efficiency, a little PHS and huge amounts of battery.
Craig, we’ve had this discussion elsewhere, but at the risk of repeating myself it’s absolutely pointless to talk about the notional maximum capacity of interconnectors – typically that would mean thermal capacity of the lines etc under steady state conditions – when looking at their actual capability to transfer power over long distances in a real power system.
The key limiting factors on what interconnectors can actually transfer can often be nothing to do with that thermal capacity but with *transient* electrical phenomena that occur if there is a fault or trip leading to sudden changes in flow and/or impedance and/or phase angle along the interconnection path. In the case of QNI and Directlink, there is a very long distance between major generators in NSW and load centres in Queensland, which makes this interconnection quite susceptible to voltage collapse if a fault were to occur with flows out of NSW exceeding certain thresholds.
AEMO uses a large number of constraints to manage these risks – which can arise on trips of different generators in Queensland, lines in NSW and so on. The limits imposed by these constraints are quite dynamic and I wouldn’t pretend to understand all the factors involved. The bottom line is that it is not at all unusual to see net exports from NSW to Qld limited to only a few hundred MW at times of high demand in Queensland.
Recent work on upgrading points along the QNI flow path – involving both lines and new equipment at terminal stations – should see some increase in capability later this year. But that capability will almost NEVER approach the underlying thermal capacity of the transmission lines themselves.
On March 8 there was an outage impact on flows (apparently a Static Var Compensator at Lismore or Armidale), but it still only reduced transfer capacity relative to system normal (nil outage) conditions by something like 100 MW.