Dan’s already posted today about an earlier ‘Run of extreme prices in the SA region on Friday 8th December 2023’. But it’s worth also noting a price spike in NSW:
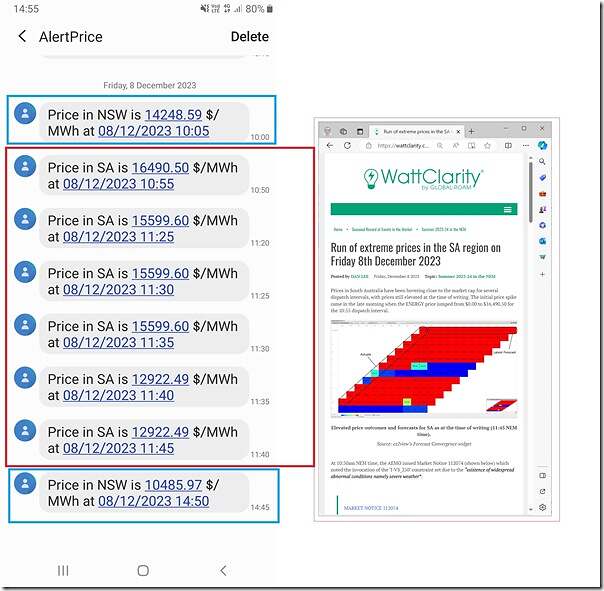
1) At 10:05 to $14,248.59/MWh and
2) At 14:50 to $10,485.97/MWh, as shown in the following run of price alerts via SMS today:
There’s more we could drill into about the SA volatility, and may do later – but here’s some quick notes about the NSW spikes:
(A) NSW Spike to $10,485.97/MWh at 14:50
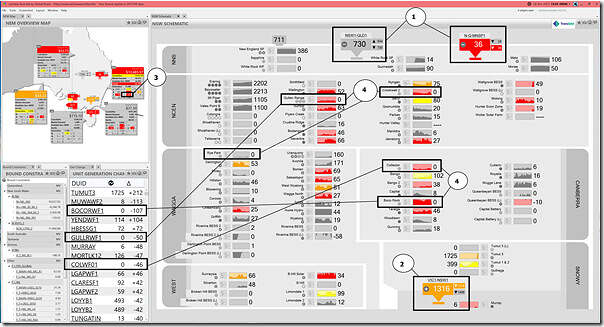
Here’s a snapshot from ez2view Time-Travelled back to 14:50 from later this afternoon (i.e. so the data shown shifts to FinalMW, but there’s not yet ‘Next Day Public’ data to see bidding behaviour and so on):
With respect to the numbered annotations:
1) Both QNI and Directlink are flowing south, as would be understood by the price differential (i.e. cheap to expensive);
2) Whereas the VIC1-NSW1 interconnector is being constrained such that it must flow south;
3) There’s a 247MW aggregate drop in wind output in NSW in this dispatch interval
4) The contributions to this reduction include:
(a) Down 107MW at BOCOROCK
(b) Down 81MW at GULLRGWF (i.e. the three unit station ID)
(c) Down 46MW at COLWF
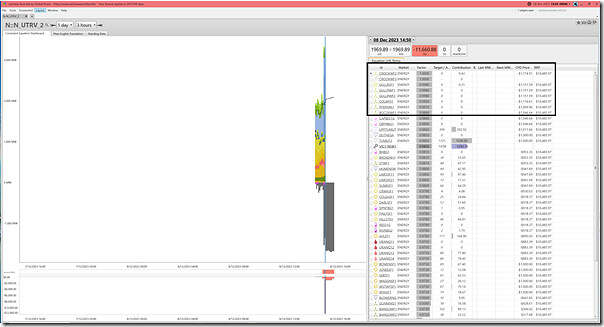
These units are all being constrained off as a result of the ‘N::N_UTRV_2’ Constraint Equation (invoked as part of the ‘N-RVYS_2’ Constraint Set due to outage on Ravine to Yass (2) 330kV line), as we can see here in the ‘Constraint Dashboard’ widget for that same dispatch interval:
Note that:
1) the ‘Connection Point Dispatch Price’ (i.e. the CPD Price) is below –$1,000/MWh for all of these units, so they’re wound right down to 0MW.
2) Eagle eyes will also see that the UPPTUMUT unit has a CPD Price below –$1,000/MWh so might wonder why the unit’s not fully wound down.
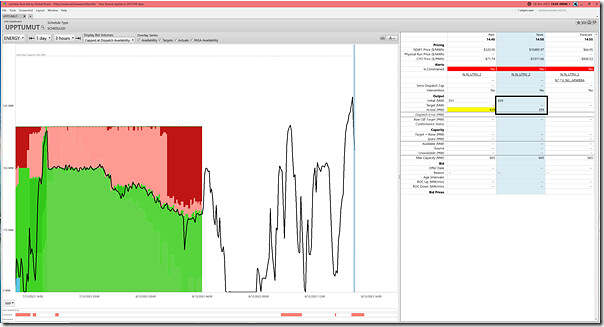
(a) Here’s the ‘Unit Dashboard’ widget for that unit – which is unfortunately limited by what it can show without ‘Next Day Public’ data:
(b) We see it did drop 40MW over the dispatch interval (439MW to 399MW) so it’s target might have dropped by 40MW, which would equate to a 8MW/min ramp down rate. Not shown in an image in this article, but clicking back to a point in the prior Market Day shows its bid ROCDOWN rate then was 20MW/min … so
i. Perhaps this changed for the 14:50 dispatch interval …
… if it was, it would have been a change in the ROCDOWN rate for 14:45 as we see a 112MW ramp down in the dispatch interval (i.e. 22.4MW/min) immediately before?!
ii. … or perhaps the unit was limited in how it could ramp down by some other parameter (such as co-optimisation for FCAS)?
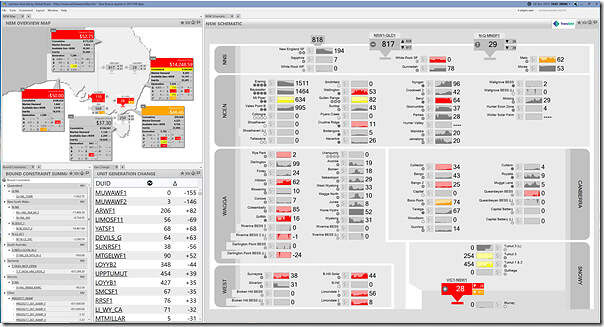
(B) NSW Spike to $14,248.59/MWh at 10:05
Without any commentary, here’s the earlier spike in the same collage of widgets:
(C) Forecast demand spike for this evening
Also worth noting that we might see NEM-wide ‘Market Demand’ peak above 30,000MW around 17:30 this evening (NEM Time), which would be first time since 24th July 2023.
PS …. here’s where it landed


Leave a comment