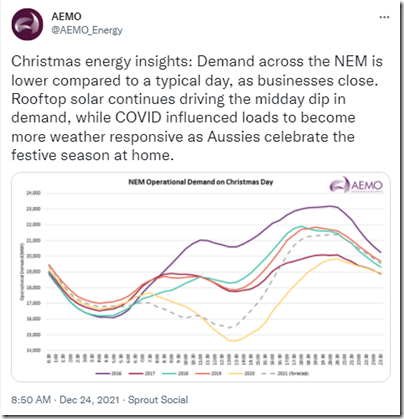
On Christmas Eve this year, AEMO tweeted this expectation that Operational Demand would not reach the depths of Christmas Day 2020:
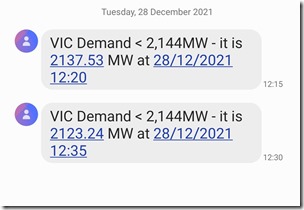
My SMS alerts are set with respect to ‘Market Demand’ – as it has the longest history of publication, and is still referenced by many participants by virtue of its direct feed into the NEMDE dispatch process, and so impact on prices. These had been quiet over the long weekend except for this short burst in the middle of the day today (Tuesday 28th December 2021):
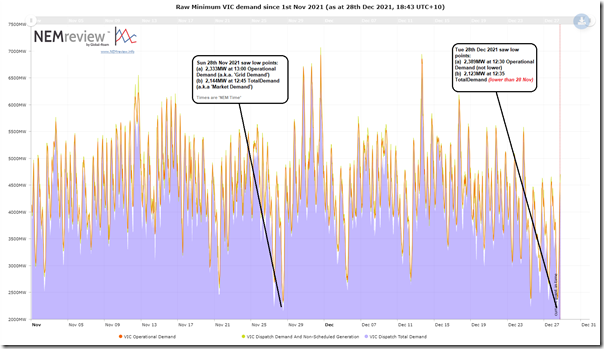
The trigger level of the alerts (2,144MW) had been set based on the low-point achieved in Victoria for that measure on Sunday 28th November 2021 (i.e. the day after Daniel Lee posted about SA demand dropping low again as well). We can the two days compare in this trend of three different measures of ‘demand’ from NEMreview v7 :
If you have your own licence to the software, you can open your copy of this template here.
As noted in the image, the low point today for ‘Market Demand’ was a shade lower than the previous low point (i.e. 2,123MW at 12:35 today being 21MW lower than the 2,144MW at 12:45 on Sunday 28th November).
However the low-point for ‘Operational Demand’ today (2,389MW in half-hour to 12:30) was still 56MW above the lower point on Sunday 28th November (2,333MW in half-hour to 13:00) … but it was lower than what the lowest point had been (2,402MW) on 31st October 2021 when I posted this tabulated record of the low points for these two main measures (I really will have to update this early in 2022!)
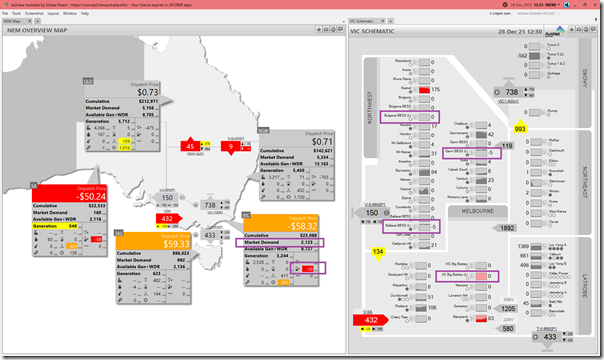
Finally in this article, it’s worth using this Time-Travelled snapshot from ez2view of the 12:35 dispatch interval earlier today (i.e. not ‘Next Day’ yet, so no bids visible – but DUID output shifted to show Final MW not Initial MW) to show what was happening at the time:
Three points to observe today:
1) We can see that the price was negative in the VIC region, and also in the SA region (down at a ‘negative LGC’ level)
2) But despite the negative prices, the four batteries in the region were only collectively charging at 10MW … the ‘Victoria Big Battery’ is coloured red because it has just reduced (to 0MW) from charging at 21MW five minutes beforehand.
3) Plenty of transmission constraint activity, with a number of DUIDs affected simultaneously by three different constraints (with the ‘X5 Constraint’ being one of those).
There’s bound to be much more that could be observed, but no more time today.
———–
For those who have already purchased access and so can download their copies, Appendix 14 inside of GenInsights21 contains some analysis of minimum demand, with a particular focus on ‘Market Demand’. For those who want access, you can order your copy now.


Leave a comment