A short (and no doubt interim) note, as the situation is unfolding through today …
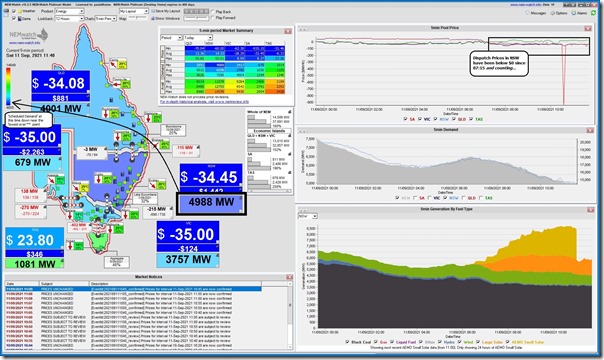
The bottom has dropped out of NSW demand today – with it dropping to levels not seen for many years – as picked up in this snapshot from a release of NEMwatch v10.2 for the 11:40 dispatch interval:
As highlighted in this snapshot, the AEMO ‘TOTALDEMAND’ figure … which some refer to as ‘Market Demand’ (and is close to ‘Scheduled Demand’) was down at 4,988MW at 11:40:
1) Which is right down the ‘deep blue’ end of the colour coding range
2) Note that the 4,605MW setting the bottom mark might be loosely thought of as ‘lowest ever’:
(a) But that’s really only ‘since the start of the NEM’
(b) Though at least it is a measure AEMO (and NEMMCO beforehand) have been publishing since NEM start. It’s not perfect, but at least is a consistent measure reflecting the size of the market generators that respond to dispatch targets (i.e. fully Scheduled and Semi-Scheduled units) have to work with in supply of their product.
3) For those readers interested in the gory details, see here for a description of the complexities of measuring and reporting something as seemingly simple as ‘demand’!
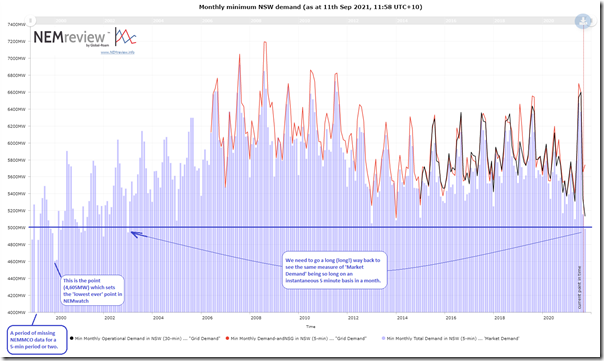
(A) Trended Demand over 20+ years
To have some context of how the monthly minimum points have trended, we open up a pre-configured trend in NEMreview v7 to show the trend of how several different measures of demand published by AEMO have trended since the start of the NEM:
Clients with licensed access can open their own copy of this trend here.
No doubt AEMO (and/or TransGrid) will be along later today, or tomorrow, to provide some official notice of how low they measured the demand to be today:
1) Readers should note that they will typically speak about ‘Operational Demand’
2) Which is a measure that’s only being published since December 2014 on a half hourly basis (not sure if it will revert to a 5-minute value from Five Minute Settlement in a couple weeks),
3) It’s a reflection of ‘Grid Demand’ (i.e. all the demand AEMO can ‘see’ in real time) – and is part of AEMO’s focus of ‘keeping the lights on’…
4) Note that this is different than (and typically larger than) ‘Market Demand’ – which many participants still keep an eye on as a measure of ‘how is the market working?’ (which is not 100% the same focus).
(B) Fuel mix today
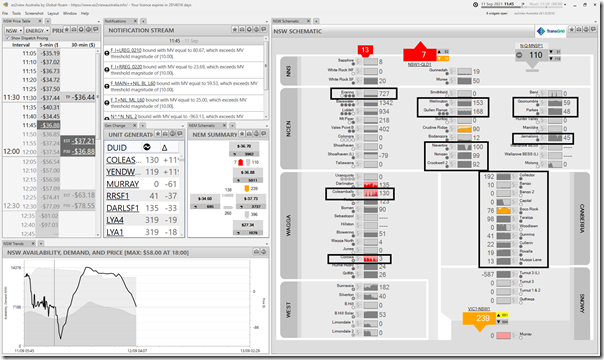
To provide a quick view of the fuel mix operational today in the NSW region, here’s a snapshot from ez2view at 11:45 (a copy of v5.1 that we installed internally just yesterday as the next advance … release for clients soon):
With prices in the NSW region negative since 07:15 this morning (i.e. 4 and a half hours earlier at this point) it’s interesting to note a number of things, including these three:
1) The effect of either the negative prices, or the constraint equations in effect, or both, is clearly seen with some plant – like Darlington Solar Farm, Coleambally Solar Farm, and Corowa Solar Farm
2) But there are a significant number of Semi-Scheduled plant that have continued to run regardless of the negative prices … presumably in part because the price has only been ‘just’ negative and so their net revenues are still positive when factoring in LGC revenue.
3) Also of note is the Eraring plant – three units online and operating down at (only) ~25% capacity factor for the station (and also Mt Piper unit 1 down quite low) … one illustration of the fact that some coal units have more flexibility than some energy commentators give them credit for (though obviously there is a limit to the capability – due to a combination of technical and commercial factors).
(C) Another ‘Big Hairy Audacious Goal’ (BHAG)
Seems the season for energy sector stakeholders trying to outdo each other with Big Hairy Audacious Goals (BHAG – for those who have read Jim Collins).
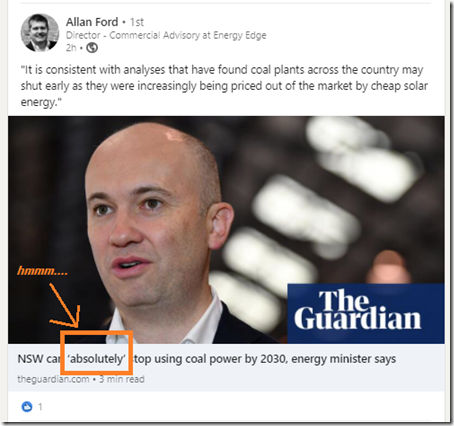
Not so long ago the new AEMO CEO spoke at CEDA in Melbourne about his own BHAG, it seems that the NSW Energy Minister has pronounced his own – reported when by the Guardian as saying that ‘NSW can absolutely stop using coal power by 2030’!
Note that I don’t share the same level of unbounded optimism as the NSW Energy Minister (i.e. in the ‘absolutely’ part of the statement – especially in the implication that he’s talking about much more than an occasional intermittent event) – but what’s happening as I write this today is clearly pointing to an enormous, and fast-emerging challenge that was the nub of this ‘forecast, of sorts’ back in July 2017 at the Clean Energy Summit … back in the day where we used to do these things in person.
Thankfully a number of steps have been taken in the 4 years since – but there are so many more that need to be taken to counteract the various villains all acting in different ways to make this energy transition a train wreck.
As time permits we’re continuing to explore some of what is shown in real data – to be released eventually in GenInsights21 (when we finish it … but certainly not in Q3 2021!).
———-
PS1 as I expected, AEMO did indeed report (here on LinkedIn, and also on Twitter) later that there was a minimum Operational Demand record down at 5,065MW at 12:30 on Saturday 11th September.
PS2 it was also low on Sunday 12th September but (using Operational Demand as the measure) not so low as Saturday.


Hi paul
Great work as usual. Suggest you may want to do a piece soon comparing how well different ageing plants are going at developing more flexibility under these conditions. In particular which ones are successfully getting to the lowest mingens for extended periods.
On 16 December 2020 Watt Clarity with the permission of David Leitch and Ben Willacy reproduced their article “Wind and Solar transactions: what to buy in the new year sales”. The article contained a table which specified the type of revenue (Power Purchase Agreement or merchant). It further stated the remaining lifetime of the contract based on a notional life of 25 years for wind and solar farms. Would be great to see this table updated together with what public companies are reporting as their asset life. One of the major investors in Australia in its Interim 2021 Results on 30 July 2021 reported “Depreciation and amortization expense was almost stable (up €0.2 million), as the mechanical increase reflecting growth in assets in operation was offset by the positive impact of extending the useful life of wind and solar farms from 25 to 30 years. Are other public companies reporting a 30 year asset life? AEMO use an economic life of 25 years (period of time required for the project to recover build costs) and a technical life of 30 years (period of time the project is operational before life extension refurbishment or retirement).In AEMO’s 2020 Inputs and Assumptions Workbook the retirement costs of single axis tracking solar farm was $21,7366/MW and a wind farm $10,883/MW (real 2020 $). AEMO did not specify retirement costs for solar and wind farms in its 2021 Inputs and Assumptions Workbook but the workbook did update retirement costs for coal and gas generators. The first wind farm in Queensland was built in 2020 and AEMO has it retiring in 2025 – its a baby compared to today’s wind farms ie 20 turbines with a capacity of 12 MW.