This morning I published this summary of pricing patterns through Q2 2021. At the end of this article, I asked the question …
Why was the market so blindsided by where average spot ended up for Q2 2021?
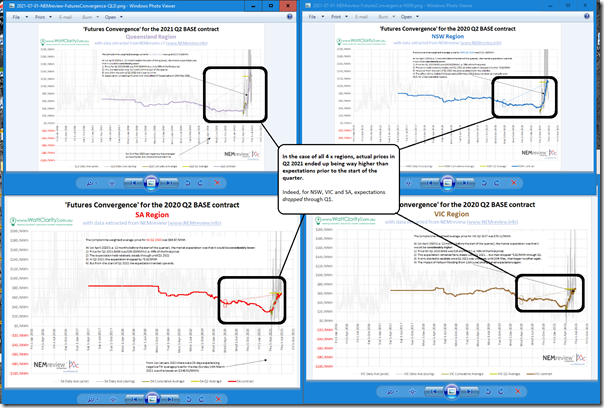
The reason for the question was that price outcomes through the quarter were clearly well above what was expected beforehand – as seen in the 4 x ‘Futures Convergence’ charts included in the article above, and mashed together here:
What’s particularly of interest to me is that (for NSW, VIC and SA – but not so for QLD) we see that price expectations, seen in the futures price for Q2 BASE, actually trended downwards through Q1 2021 – before quickly reversing course almost as soon as Q2 started.
Hence the question … why was the market so blindsided? As it so clearly was!
Possible contributing factors that occur to me…
(A) One Factor = Unexpectedly poor availability of coal plant across the NEM
On 16th June 2021 I already noted how the ‘Availability of Black Coal units has suffered through Q2 2021’.
Two key points about that analysis:
1) It deliberately excluded what was going on in the 10 x Brown coal stations (as the volatility had been moreso centred on NSW, and then QLD); and
2) It only looked at performance in comparison to prior Q2 periods … not performance compared to what was expected prior to the start of Q2 2021 (i.e. and should, presumably, fed into trader’s price expectations in the futures price).
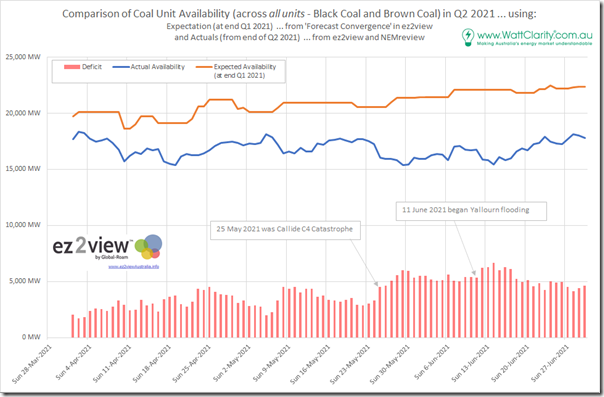
Thankfully with the ‘MT PASA DUID Availability’ widget in ez2view we can quickly extract a view of what the expected aggregate availability would be for all coal units across QLD, NSW and VIC for each of the 92 days through the quarter. I picked a run towards the end of March 2021, but not right at 31st March in order to provide visibility of expectation for 1st April 2021.
In the chart below, I have compared this with the daily average actual aggregate availability that was delivered on each of these days.
Whilst there might be a slight quibble* that this is not strictly ‘apples to apples’ comparison, there is clearly a big difference for all of the days in the quarter:
* for instance, a slight quibble is that MT PASA data is one data point per day, being peak availability expected, whereas the actual historical data is an average across the day (so, for instance, if a unit was only expected back from evening peak and it delivered, the calculation above would still see this as a deficit).
Some observations
1) There was a significant underperformance on all days.
2) This started from the start of the quarter:
(a) so it pre-dated the two headline events,
(b) but it ramped up through the quarter,
(c) though this increase in shortfall/deficit also predated the two headline events (so there were clearly other things going on with other units).
3) When the Callide C4 Catastrophe occurred (from 25th May 2021), it drove the aggregate shortfall/deficit higher … over 5,000MW in aggregate for some days (which is approximately 25% of aggregate capacity expectation).
4) When the Yallourn Flooding event occurred (from 11th June 2021), it similarly drove aggregate shortfall/deficit higher still.
It clearly was a bad quarter for coal unit performance (though perhaps not for revenues for any portfolio that actually met their expected contribution – I’ve not checked who that might be)!
(B) Other Factors?
It may be that there were other factors at work … for instance:
1) I have not looked at the extent to which demand patterns might have been different to expectation (e.g. perhaps higher?).
2) We already saw here that the other Scheduled plant did not suffer as much compared to other Q2 periods … but we’ve not looked at how their actual performance varied compared to expectation at the start of the quarter.
3) I’ve also not looked at how Semi-Scheduled plant performed against expectation (again lamenting how Villain #8 makes this impossible to do, in terms of expectations of technical plant availability).
4) I’ve also not thought of network limitations, or fuel availability (e.g. gas), or reasons why bidding behaviour might have been different from expectation, and so on….
5) Perhaps our readers can think of others….
However it does appear that the unexpectedly poor coal unit performance was a big one! This is something we’ll continue exploring in more detail (and not just to do with Q2 2021) in GenInsights21…


So much for lots of little guys helping out with the demise of dispatchable coal generation-
https://reneweconomy.com.au/did-aemo-just-kill-off-the-market-for-battery-based-virtual-power-plants/
That’s the consensus Green dream and you can sense already they’ll see the AEMO’s stance as somewhat of a conspiracy by big generation and the regulator.
With solar FIT rates dropping continuously with a glut of rooftop solar and no forseeable economic case for home batteries there’s only one viable option for the little people going forward-
https://www.solarquotes.com.au/hot-water/pv-diverters/
They might also store solar energy in the home with the right gear-
https://www.solarquotes.com.au/blog/divert-solar-air-conditioning/
Nothing surer than the demise of coal coupled with all those prospective EVs charging at night peak grid power rates will be after sundown.