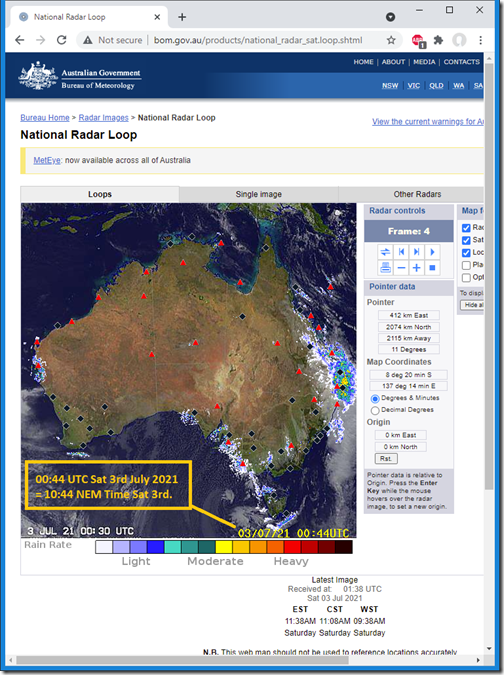
It’s been a rainy Saturday morning in Brisbane, and right across much of coastal Queensland (particularly so in the southern half), as we can see in this snapshot of the BOM’s national radar from 10:44 NEM time:
This has obviously placed a damper on harvest from solar PV across much of the state, and sets the seen for some price volatility in the QLD region through this morning.
(A) Spot Price Volatility in ENERGY
Yesterday morning we published this review of a particularly volatile Q2 2021 … but we need to recognise that these conditions have not totally disappeared, yet – with the rainy weather providing one contribution to
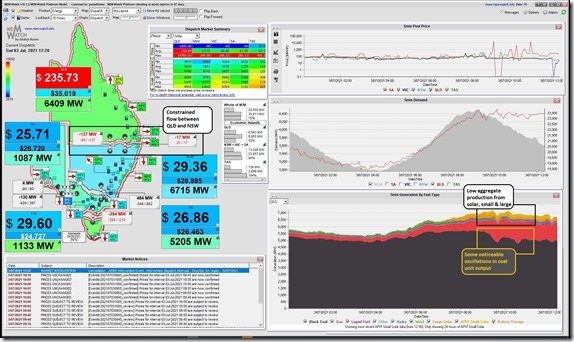
Here’s a snapshot taken in NEMwatch v10 today at 12:20 :
I’ve highlighted three factors in the physical market, and there are probably others:
1) We see that flow between QLD and NSW is constrained – as it has been for a number of hours (enabling prices to separate);
2) We see low aggregate output from Large Solar Farms and Rooftop PV (the highest it’s reached so far today has still been below 500MW – using the APVI’s estimates);
3) We also see a couple oscillations in aggregate coal output … but these occur after the 09:15 and 10:20 price spikes
Whilst the price has been elevated for much of the day, to date (compared to the southern regions) there are three particular price spikes that stand out (noting that each fall within different trading periods as a quirk of the 5/30 issue that will be going away with Five Minute Settlement (what quirks will take its place?):
(A1) Price spike to $14,700/MWh at 09:15
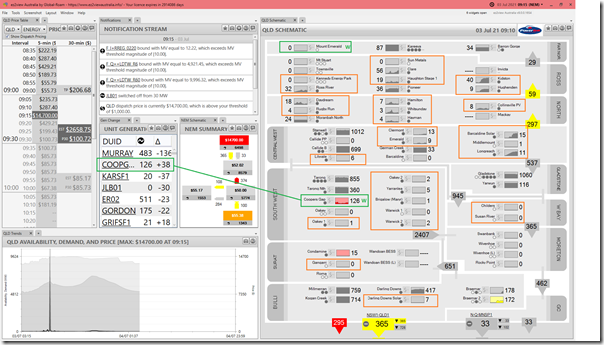
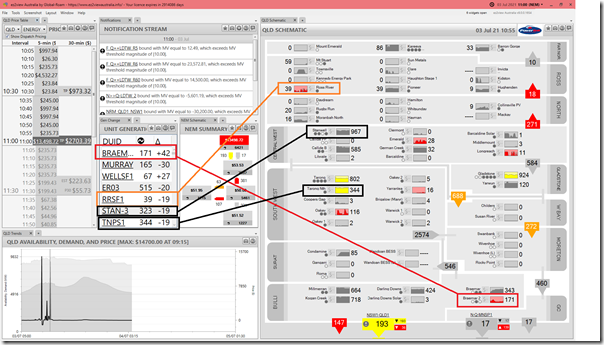
Here’s a snapshot from ez2view v9 (a pre-release version we’re testing for 5MS) showing what happened at the 09:15 dispatch interval:
A couple quick notes:
1) I’ve highlighted the 2 x Wind Farms in QLD currently – for reasons not investigated, no output at Mt Emerald Wind Farm in FNQ;
2) I’ve also highlighted the multitude of solar farms spread across the state:
(a) Keep in mind that some (like Gangarri) are not yet producing output – and some (like Warwick and Sun Metals) have been undergoing physical repairs;
(b) Looks like all of the southern solar farms have basically no output at all – which will be because of the rain/cloud pattern.
(c) Solar farms in the northern half of QLD (i.e. from ‘Central West’ upwards) are more of a mixed bunch:
i. A couple (Kidston & Hughenden, Barcaldine & Longreach) are producing output – which i think is because they are far enough west to avoid the cloud; but
ii. Most are fairly low and choppy.
3) With the coal units:
(a) We know already that the Callide C4 Catastrophe means that Callide C3 and C4 are still offline,
(b) Plus there are a couple other units offline (Stanwell 2 + Gladstone 5 & 6)
(c) Of the units that are running, however, we see that they are running close to flat out.
4) The hydros in FNQ are producing steadily – but not Wivenhoe.
5) A couple of gas units are running (in the Bulli zone).
6) We also see that QNI and DLINK are constrained such that they must flow south
(a) by virtue of Constraint Equations in the ‘N-LDTW_84’ Constraint Set (which relates to an ‘outage on Liddell to Tamworth (84) 330kV line’).
(b) this means that QLD needs to supply both itself and parts of northern NSW with ENERGY and FCAS.
(A2) Price spike to $4,532.27/MWh at 10:20
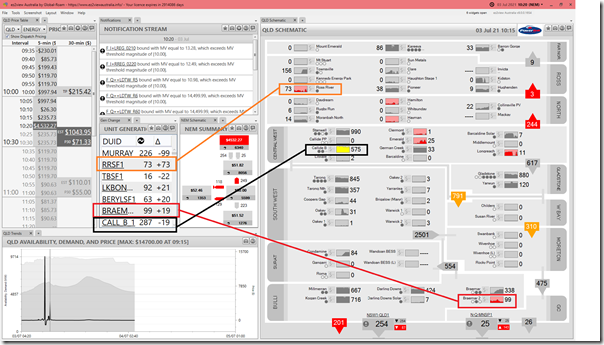
Winding the clock forward, we see a very similar picture for the 10:20 dispatch interval:
The trended capacity factor charts for each station in the QLD schematic highlight both:
1) A few (solar) stations dropped output in the 65 minutes following the 09:15 price spike despite the fact that the 09:30 and 10:00 trading prices were quite healthy.
Perhaps a result of some rudimentary bidding behaviour (something we’re looking forward to exploring directly as part of GenInsights21 – to the extent that time constraints allow)?
2) With the coal stations, we can see some drops in output that followed the 09:15 dispatch interval … but remember that there may be several reasons for this, including the result of co-optimisation with their provision of Raise FCAS (given they are the units online and providing it).
(A3) Price spike to $13,498.72/MWh at 11:00
Here’s a snapshot of the price spike for the 11:00 dispatch interval (i.e. last DI in the 11:00 Trading Period, which was adjacent to the 10:30 trading period buoyed by the 10:20 dispatch interval spike):
(B) Don’t forget about FCAS!
Harking back to Allan’s admonition from February 2020 – ‘don’t forget about FCAS!’, it’s useful to also remember that it’s not just ENERGY prices that we should be looking at. Thankfully it’s possible to watch these through our software.
(B1) Sustained high prices in Contingency FCAS (Raise 6 second)
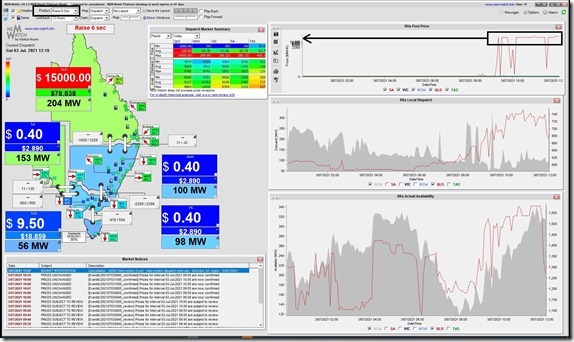
Here’s a snapshot taken from the ‘RAISE6SEC’ layer in NEMwatch at 12:10 today:
We see that the price for the Raise 6second (i.e. ‘FAST’) contingency response has been up at the Market Price Cap for essentially the whole of the morning.
(B2) Sustained high prices in Contingency FCAS (Raise 60 second)
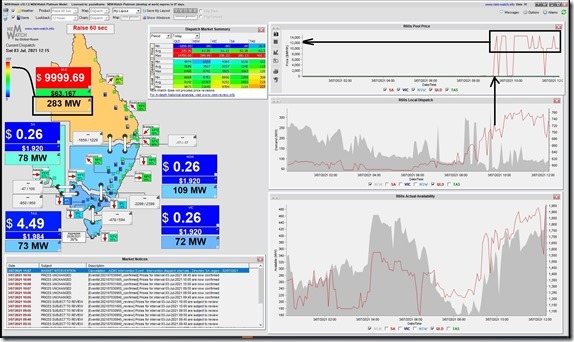
Also elevated are prices for the ‘RAISE60SEC’ commodity:
In the same sort of way as for Raise 6 second, the increase local dispatch through the morning led to an escalated price that has mostly remained at or above the current level of $9,999.69/MWh for a number of hours.


Be the first to comment on "Price volatility in the QLD region on Saturday 3rd July 2021"