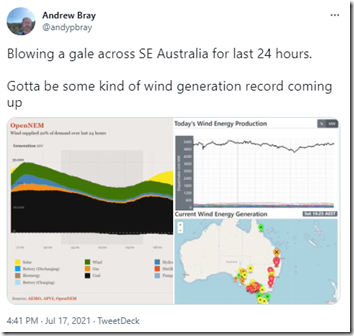
It’s been windy enough in Brisbane since Friday afternoon (like the Ekka winds) to make it feel like winter again (albeit a Brisbane one) – and I saw Andy Bray speculating about some kind of wind generation record:
Congrats on the CEC award, also Andy!
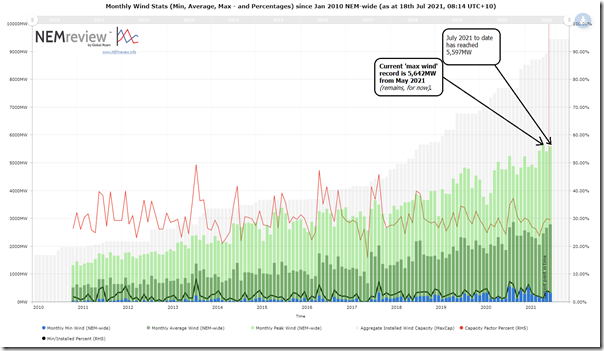
With my curiosity spiked, I opened this pre-prepared query in NEMreview v7 that that I have used in a number of articles here previously:
Clients with a licence to this NEMreview software can open their own copy of this query here.
A couple quick notes:
(A) Close to the peak instantaneous output record
As noted on the image, the peak (thus far) in July 2021 (i.e. 5,597MW) is not quite as high as what was recorded in May 2021 (at 5,642MW). Aggregate wind production has dropped significantly NEM-wide through Sunday daylight hours to suggest that the prior record is still safe … for now.
(A1) Growth in peak output
That prior record (5,642MW) was reached on 25th May 2021 – and was recorded with this ‘A new all-time maximum for coincident wind production across the NEM late on Tuesday 25th May’ article the next day.
That current record exceeded the 5,430MW point reached at 23:55 on Tuesday 13th April 2021, and which stood briefly as the record.
(A2) First output from some new capacity
Adding to the mix are a couple of wind farms that have newly seen output in the NEM.
I’d expect these will be discussed by Giles over on RenewEconomy in the coming days…
(B) Peak output not keeping pace with growth in capacity?
When discussing this same chart internally recently, a comment was made that the growth in peak (i.e. light green bars) has clearly not kept pace with the installed capacity (i.e. the light grey bars – measuring aggregate Maximum Capacity as registered with AEMO). There are a couple reasons for that, including these two big ones:
(B1) Increased diversity (i.e. a ‘good’ reason)
As more wind farms have been built, there’s increased geographical diversity in where they are constructed … and that is generally a good thing (though we’d urge caution those remaining who still (mistakenly) believe diversity is a panacea … or a magic wand).
This increased diversity means that the peaks should become more consistent, over time … and hence grow less quickly (even in relative terms) than the installed capacity.
(B2) Increasing delays in commissioning (i.e. a ‘bad’ reason)
Coupled with the above is also a more troublesome contributing factor … and that is an increased amount of delay in the commissioning process. This shows up in the chart above in an increasing lag between when full capacity is shown in the ‘installed capacity’ chart and the
Readers should certainly not take this as us blaming AEMO for these delays:
(a) I know that many do (but in my view that is grossly simplistic … and also counter-productive moving forwards);
(b) as I have noted before, there are complex underlying reasons why a variety of problems (including these delays) are occurring – and AEMO is only one of a significant stakeholders involved in the process (and seems to me not to be the main contributor).
(C) Average Capacity Factor
Also worth pointing out that the monthly aggregate capacity factor (i.e. the red line on the chart above) is oscillating less and less around 30% aggregate capacity factor.
This is also to be expected … as a natural outcome of this geographic diversity.
(D) Minimum monthly output
However (as noted in prior articles here, and also speaking to Villain no6d), the minimum monthly output numbers remain stubbornly low … both in absolute (i.e. MW) terms and in relative (i.e. percentage) terms.
(E) Further analysis of this challenge
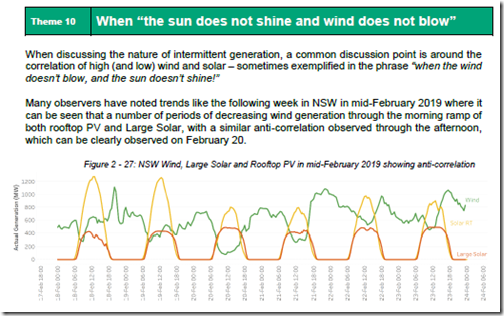
Frequent readers here will remembered that we examined the questions surrounding the meme ‘when the sun does not shine and wind does not blow’ as part of the Generator Report Card 2018 a couple years ago now:
That was in Theme 10 within Part 2 of our 180-page analytical component.
We’re 90% completed on a major extension to what we did in the GRC2018 that will form a large appendix within the upcoming Generator Insights 2021 release. This Appendix was discussed briefly in this update on GenInsights21 from 20th April 2021.


Leave a comment