As I publish this report (at 17:54) there have been instances of extreme (i.e. >$1,000/MWh) prices in QLD and NSW this afternoon/evening as follows:
1) 1st spike in QLD at 15:40 (to $13,988.00/MWh) – a little earlier than normal, in part because of lower solar output (and higher gas generation, as noted earlier).
2) 2nd spike in QLD at 16:15 (to $13,988.00/MWh) – the next trading period
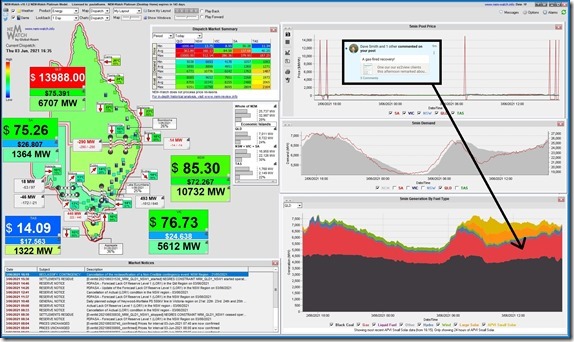
3) 3rd spike in QLD at 16:35 (to $13,988.00/MWh) – the next trading period. Here’s how this was captured in the NEMwatch v10 snapshot at the time:
Note the tongue-in-cheek exclamation by Dave Smith about a ‘Gas Fired Recovery!’ in response to my earlier article about heavy use of gas-fired generation through the day, and see the solid block of red there.
4) 4th spike in QLD at 17:10 (to $13,988.00/MWh)
… so 4 trading periods in a row. Note the pattern here (complete with negative prices in between)?
5) 1st spike in NSW at 17:25 (to $5,968.80/MWh)
6) 2nd spike in NSW at 17:30 (to $4,751.67/MWh)
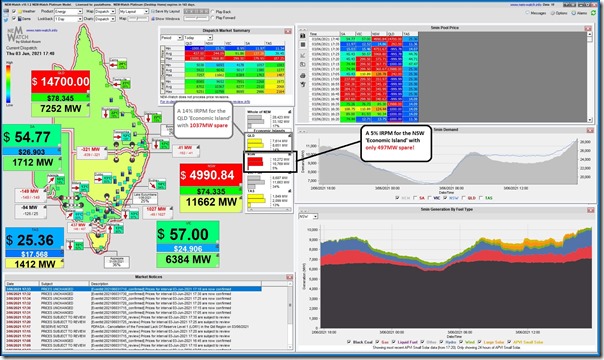
7) 5th spike in QLD ($14,700/MWh) and 3rd for NSW at 17:40 ($4,990.84/MWh). Here’s a look at this one in NEMwatch v10:
Note the following:
(a) Tight supply/demand in QLD (a 14% IRPM for the ‘Economic Island’) and a very tight supply/demand balance in NSW (a 5% IRPM with less than 500MW spare!)
(b) Scheduled Demand in NSW (at 11,662MW) up in the ‘yellow’ colour band – based on the historical range.
8) 4th for NSW at 17:45 ($14,381.81/MWh) and 1st for Victoria ($1,290.61/MWh).
————-
There was also a spike in QLD this morning (to $15,000/MWh at 07:30).
It’s been an unusual past 4 weeks!
————-
PS – note that the volatility continued into the evening, but I’m not going to update this article further…


Leave a comment