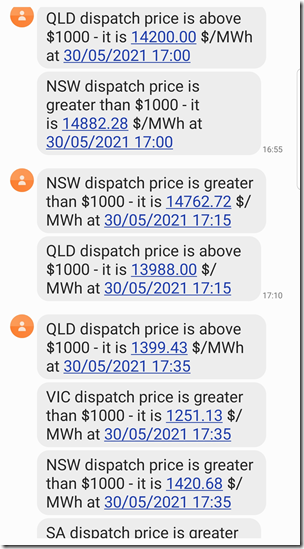
My phone was buzzing tonight with SMS alerts with prices (from ez2view and NEMwatch) spiking across the mainland, but mainly in NSW and QLD. Here’s some samples:
This was also the case on Friday evening – and is the type of thing I was thinking about when I named this ‘Headline Question 5 – Risks through until early June’ here.
(A) Low IRPM experienced following the Callide catastrophe
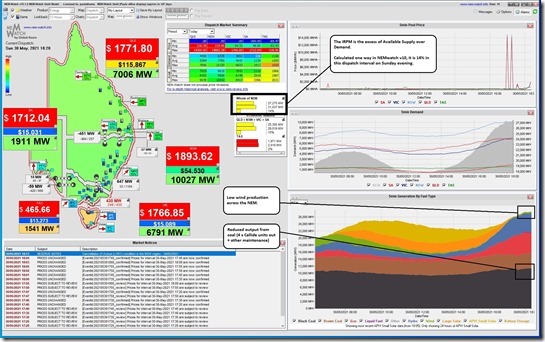
Here’s a snapshot from NEMwatch v10 for the 18:20 dispatch interval that highlights more than just the price spike:
I’ve highlighted calculation of ‘NEM-wide Instantaneous Reserve Plant Margin (IRPM)’ built into NEMwatch.
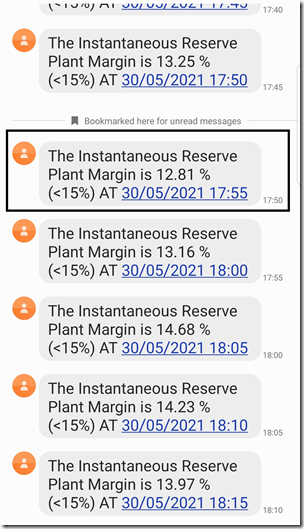
At the 18:20 dispatch interval we can see that IRPM was at 14% (rounded up – actually 13.79%). Here are IRPM in some other dispatch intervals that have also been buzzing my phone:
This evening (on the NEMwatch image above) I have noted 3 contributing factors:
1) There are the 4 x Callide units now offline (3 of them forced offline with what happened on Tuesday 25th May – with 2 to return during the coming week (Saturday and Sunday, on current schedule)
2) There are other (coal and other) units still out on maintenance preparing for the higher winter evening peaks in demand (and Kogan limping on with a tube leak); and
3) There’s a coincident very low wind output right across the NEM (below 200MW this evening).
… and note that there may be others as well.
(B) Quite low, by historical standards
It’s quite rare that we see numbers this low…. yet the low points over the past couple days have been as follows:
1) Friday 28th May 2021 = 12.78% at 17:55
2) Saturday 29th May 2021 = 14.99% at 18:00 – only a single DI below 15% yesterday evening.
3) Sunday 30th May 2021 = at 12.81% at 17:55 as in the image above (noting that it is a Sunday evening!).
(B1) Historical Range
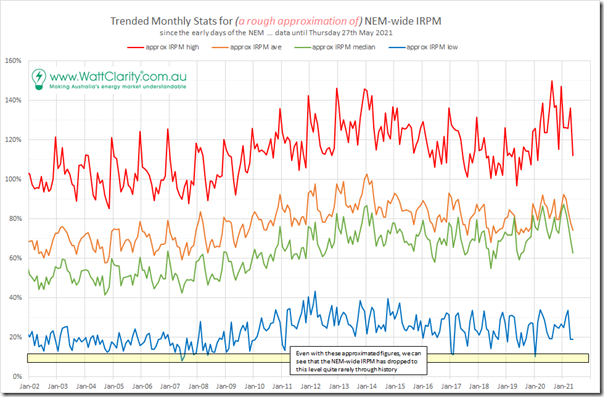
On Friday evening, when my phone buzzed with similar alerts to the above, I wondered how that level (12.78% low point for the day) compared historically, knowing that the colour alerts in NEMwatch, and the SMS alerts, trigger quite rarely. Being end of the busy week (and without the assistance of the expert data wranglers we had on our team – who are much more proficient than me) I prepared the following using a few shortcuts and data I could access more easily as an approximation of the way IRPM has trended over time:
Note that this chart includes data only up until and including Thursday 27th May (i.e. before the the low points of Friday), and that they are approximations.
They are, despite these caveats, still sufficient to illustrate how rare these low IRPM events are. I’d completed the analysis with the intention of publishing Friday evening, but did not get finished.
(B2) Notable points in history
In recent times we see that the only other times the IRPM has dropped as low as it has been over recent days following the withdrawal of Callide units, and with coincident low wind production, were:
1) In January 2020.
2) Not quite so low in June 2019.
3) Not quite so low in June 2018 (here’s Tuesday 5th June 2018 as part of a stressful week).
4) In January and February 2017 (here’s 17th Jan 2017).
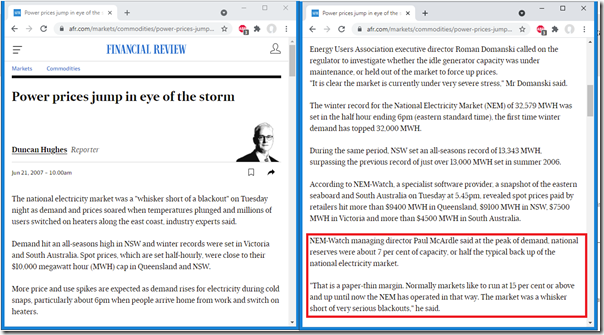
For the NEM history buffs we can see the lowest ever point being back in June 2007 – specifically 19th and 20th June 2007 when the NEM-wide IRPM plunged as low as 7.6%! Here’s how it was written up by Duncan Hughes for the AFR back on 20th June 2007:
I’m pretty sure that this is still the ‘lowest ever’ point.
(B3) Deeper Analysis of IRPM and Related Measures
When we compiled the GRC2018, we included a discussion about a related metric (DRM = Dispatchable Reserve Margin) in Theme 9 within Part 2 of the 180-page analytical component. We’re in the process of updating and extending analysis like this for the upcoming GenInsights21 release:
1) To show how the pattern of supply/demand balance has been changing; and
2) To see what’s been happening to prices as a result (and, as noted in the GRC2018, also independently of the supply/demand balance).


This is a very interesting graph. On your chart of reserve margins, is it possible to point to:
a) when actual blackouts have occurred due to supply shortages
b) generator closures
c) droughts
Also, it’s intuitive that all reserve margin is dispatchable generation – is that a correct assumption?
Also also 😂, how does the reserve margin correlate to inertia levels, or AEMO system strength constraints?