
Natural human curiosity and ready public access to the NEM’s extensive market and operational data inevitably mean that there are already dozens of analyses, discussions and speculations on social media and elsewhere about what went wrong on the Queensland grid last Tuesday afternoon. Within a few short minutes some geniuses even had solutions:

More detail on the sequence of events, and perhaps on some of the root causes, should emerge in coming days from AEMO’s initial incident report which will be able to draw on much more detailed non-public data collected from high speed data recorders around the system, plant control systems at generators and substations, and many other sources. Even so it will probably be weeks or months before the causes are fully identified, particularly those of the initial event(s) at Callide Power Station’s unit 4 which resulted in apparently catastrophic damage to its turbo-generator.
Given that, I think it may be more useful here to avoid extensively rehashing further bottom-up analysis of the public market data but to highlight things that went right during this event and prevented it from being an even worse situation for the people of Queensland, because there’s no doubt that this could quite easily have resulted in a System Black event with parallels to South Australia’s in September 2016.
Setting the Scene: T=0
Now I will promptly ignore my own advice and use some bottom-up market data to set the scene, using one compilation chart to help illustrate where these critical things went right. This is based on Paul McArdle’s detailed Brisbane frequency data (at 100 millisecond time resolution) – the blue trace below, overlaid with a couple of data series from AEMO’s four second SCADA “causer pays” operational dataset – the grey and yellow dots. The chart focusses on the 30 seconds prior to major plunge in Brisbane frequency (“Event 2” in Paul’s taxonomy) and the following minute or two. Time in seconds is measured relative to the start of the frequency plunge: T=0.
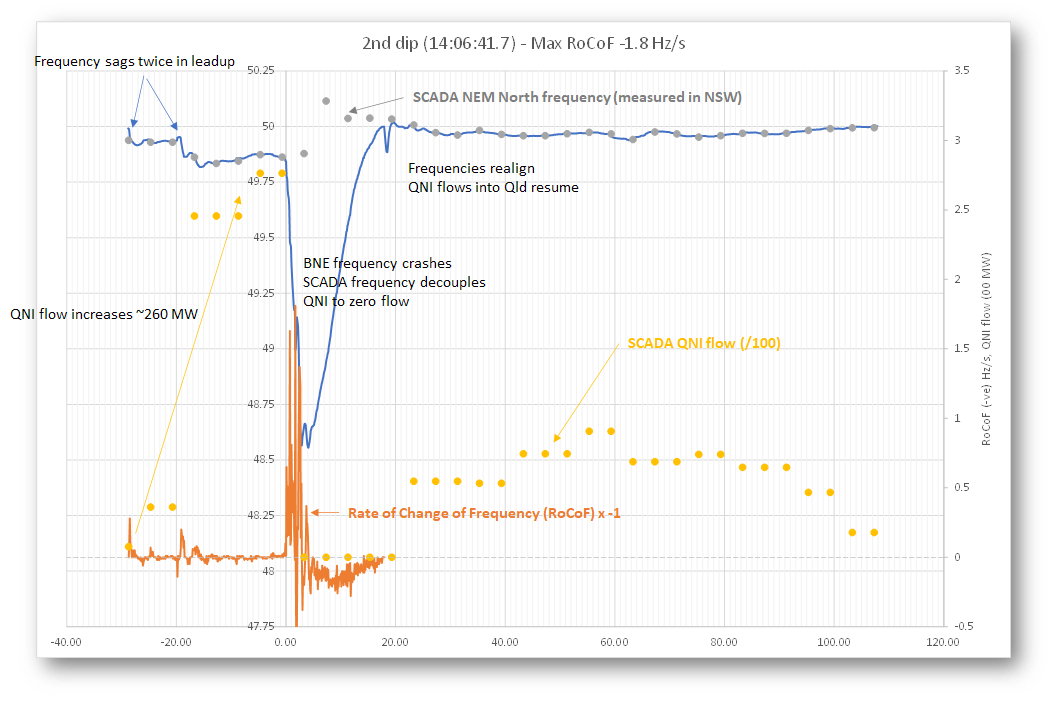
The thirty seconds prior to T=0 show a couple of features:
- Brisbane and AEMO’s “NEM North” (actually NSW) frequencies align – as expected, it’s one interconnected AC system
- Two smallish downward steps away from 50 Hz are evident, accompanied by material increases in flows on QNI into Queensland in AEMO’s SCADA data
These are very suggestive of perhaps two generator unit trips in Queensland just before the major frequency plunge, with the rate of change of frequency (RoCoF) and dip size around what would be expected in a fully interconnected NEM with plenty of synchronous inertia, and the increase in QNI flows reflecting support from the rest of the NEM for a modest supply imbalance in Queensland.
At T=0 things change dramatically:
- Brisbane frequency drops sharply with a far higher RoCoF, but the SCADA data points show:
- NEM frequency does not plunge and in fact moves upwards, while
- QNI measured flows fall to zero.
This leaves little or no doubt that at T=0 QNI tripped, leaving Queensland islanded from the rest of the NEM. The size of the Brisbane frequency fall and the much higher RoCoF indicate a larger supply-demand imbalance on an islanded grid with significantly lower inertia. We’ll have to leave the precise reasons for the trip to AEMO’s report, but my speculation is that further generation trips in Central Queensland and the resulting supply deficit caused QNI to overload and/or its “Loss of Synchronism” protection to operate.
Without going into detail this is very similar to the sequence of events immediately before SA’s System Black event in 2016 – a large loss of local generation and trip of supporting interconnector led to a frequency plunge which on that occasion was not arrested, leading almost instantly to a black system.
It was at this precarious point that things actually stopped going wrong in Queensland, although blacked-out customers there could be forgiven for not feeling exactly euphoric.
WWR (What Went Right) Item 1 – UFLS
The only mechanism capable of arresting the plunge in Queensland frequency after T=0 was Under Frequency Load Shedding (UFLS). This is the self-protective last line of defence used on all large scale AC electricity systems to deal with sudden major supply shortfalls from an unexpected critical event. Carefully selected distribution feeders supplied from major terminal stations are tripped at a series of preset low frequency threshholds by protection relays armed to quickly disconnect predetermined amounts of customer load (and where possible avoid tripping critical supplies). The aim of these schemes is to arrest a rapid frequency collapse, and restore approximate supply-demand balance to a margin within which other mechanisms can then stabilise the system. They are akin to an organism sacrificing part of itself so that the rest of it remains alive
Although UFLS relays act autonomously and rapidly, they still require enough time to sense a frequency drop before acting. If the RoCoF is too high, they will operate too late to “save the system” or not trigger at all – this is what happened in South Australia in 2016 where the very large supply-demand imbalance and low system inertia led to much higher RoCoF than the ~2 Hz/s estimated from the Brisbane data for last week.
We can see on the Brisbane frequency trace that by about T=4 seconds, UFLS had done its primary job and stopped frequency falling below 48.5 Hz.
WWR Item 2 – Frequency Restoration – FCAS & PFR?
Over the next 15 seconds or so the Brisbane frequency returned remarkably smoothly to its nominal target of 50 Hz. A range of mechanisms probably assisted this process, including
- Contingency Frequency Control Ancillary Services (FCAS). These are again preset mechanisms operating at certain generators or loads to respond to moderately large frequency deviations (below 49.85 Hz on the low side). Any Queensland generators or loads enabled beforehand for the “fast” (6 second) or “slow” (60 second) FCAS Raise services would presumably have acted after the frequency drop to help restore frequency (check this link for a visualisation by Geoff Eldridge at nemlog of some responses observed). But neither the response time nor total quantities of these services enabled at any one time in the NEM – let alone in a single region like Queensland – would have been anywhere near adequate to control the frequency plunge at T=0.
- Primary Frequency Response (PFR). I covered this mechanism, now mandatory at all larger generators, in a WattClarity article last year, and it’s probable that this was also very important in the smooth trajectory of Queensland frequency back to 50 Hz.
WWR Item 3 – Reconnection of QNI?
At about T=20, just as Queensland frequency first returns to 50 Hz, we see its trace realign with the SCADA frequency readings for the rest of the NEM. The SCADA data also shows flows on QNI moving off zero to moderate levels of import (50-100 MW) over the next minute or two. Thus it’s very likely that at this point the QNI connection between NSW and Queensland “auto-reclosed” as it sensed equal frequencies and aligned phases on either side of the circuit breakers tripped at T=0. The accuracy and details of this speculation are again something that the AEMO incident report will hopefully cover, but if correct, it would be a very impressive example of “smart” protection systems in operation – compared by one commenter to “jumping between fast-moving cars”.
Although reconnection of QNI may not have been as time critical to immediate stabilisation of the system in Queensland as Items 1 & 2, it would have added substantial resilience against any succeeding events, and also enabled increasing imported supplies later in the day as loads tripped by UFLS were restored and the evening demand peak ensued.
WWR Item 4 – Stanwell TTHL (“Trip to House Load”)
Less remarked on than the fact that Stanwell Power Station’s three online units all tripped in the critical part of Tuesday’s event, was that they “tripped to house load (TTHL)“.
This is a mode of disconnection from the grid that does not totally shut down an operating generation unit, but leaves it running at very low levels and supplying power to in-house auxiliary loads – boiler fans, pumps, fuel conveyors etc. This capability is important in restarting from a black system event (often large thermal power stations require supply from the grid to start up), but it also means that coal-fired units tripped to house load can be reconnected to the grid much more quickly than units where a trip results in a complete shutdown, cooling of boiler and turbine temperatures and so on.
This capability is illustrated via the following chart showing the three Stanwell units falling to low but non-zero output and returning to service more quickly than the tripped coal-fired units at Gladstone and the gas-fired Yarwun cogenerator. Like reconnection of QNI, the timing of Stanwell’s return would have been another important contributor to reconnection of customer load tripped by UFLS operation and sustaining the evening peak demand.
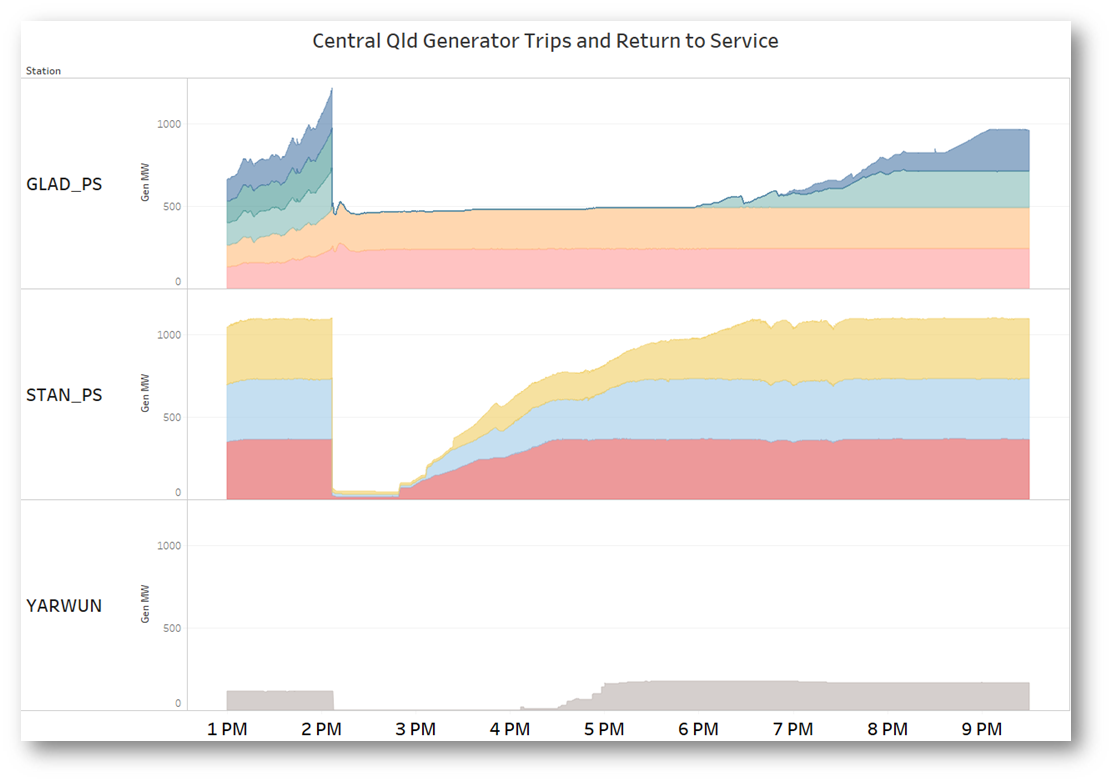
(But in defence of Gladstone, its units are not designed with TTHL capability, and as shown in the chart two of the station’s five operating units did remain online throughout.)
In Conclusion
The power system is an incredibly complex interconnected machine with hundreds of thousands of individual components, over a huge geographic footprint with unavoidable exposure to the environment. As with any large scale system, failures must be anticipated, and multiple levels of resilience built into the system. The series of events that hit the system in Queensland pushed those resilience levels close to their limits, and fortunately enough of them held up to prevent a much worse outcome.
Anyone arguing for magic bullet technology solutions that would somehow totally prevent any disruptions in the face of rare but serious future contingencies has likely not appreciated the actual nature of the risks. The system, regardless of transition in its core energy sources, will continue to depend on multiple levels of resilience to external events and ensuring these remain in place – perhaps delivered in future by quite different technologies – must remain a key focus for all stakeholders.
Finally, for those looking for a higher level overview of the events (and possibly less speculation about details than I’ve indulged in above), I would strongly recommend a couple of recently published commentaries:
- from Ben Skinner on the AEC website (with a really interesting take on the place of the market in situations like these); and
- Jay Ros and Carl Daley at EnergyBytes with some market price analysis and thoughts on repair / replacement of Callide C4.
About our Guest Author
 |
Allan O’Neil has worked in Australia’s wholesale energy markets since their creation in the mid-1990’s, in trading, risk management, forecasting and analytical roles with major NEM electricity and gas retail and generation companies.
He is now an independent energy markets consultant, working with clients on projects across a spectrum of wholesale, retail, electricity and gas issues. You can view Allan’s LinkedIn profile here. Allan will be sporadically reviewing market events here on WattClarity Allan has also begun providing an on-site educational service covering how spot prices are set in the NEM, and other important aspects of the physical electricity market – further details here. |
Thanks, Allan, for your commentary and to the people who have put together all the protection settings across the network.