Looks like this event, and the aftermath, will continue for some days (weeks and months) into the future … so:
1) As time permits, will post additional observations in separate articles; and
2) Will collate all of these in this new category here as another ‘Headline Event’ for the NEM.
3) Hopefully in a day or two valued guest author, Allan O’Neil, will have been able to publish more of a considered review of the ‘What the heck happened?!’ question, as there are plenty of discrete questions bouncing around in our heads! Won’t be today – maybe Thursday or Friday.
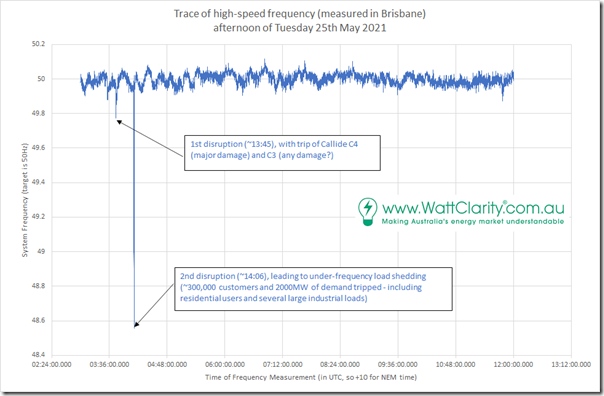
In the meantime, here’s another snippet of information, looking at System Frequency measured in our office in Brisbane through yesterday afternoon:
We’re collating this data for a few initiatives we’re working on in our ‘spare time’ (not that we have much of that) which we’ll tell you more about when we are able. It’s measured on a 100 millisecond basis.
Timestamps on the data are in UTC time, so add 10 hours to adjust to ‘NEM Time’.
I’ve highlighted the two significant dips in frequency:
Event 1 = at ~13:45 (Callide C3 and C4 trip)
At 13:44:57.003 we see that the frequency drops as low as 49.773Hz (Observation #1)… which would have been enough to trigger the FCAS contingency raise services (see this reminder of what they do).
1a) The 13:45 dispatch interval
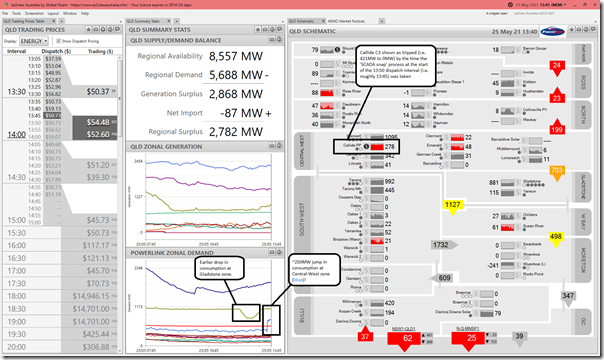
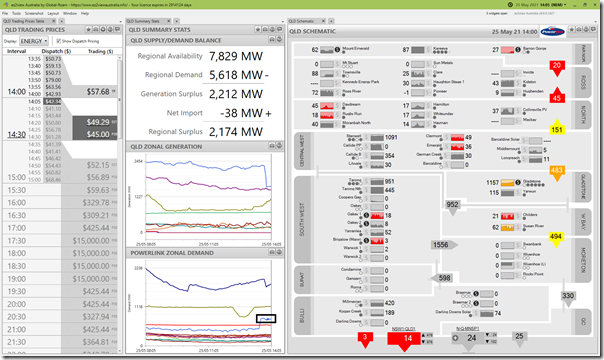
Here’s a snapshot from ez2view for the 13:45 dispatch interval (remembering that ‘end of interval’ FinalMW values are shown for each DUID in most widgets when in Time Travel):
Three observations (which are really more like unanswered questions at this stage):
Observation #2) Based on the AEMO data from the MMS, it shows that Callide C3 had just tripped by that point (i.e. NOT the C4 unit that suffered the fire!). This might be just some relation to the timing of the ‘SCADA snap’ process?
Observation #3) Prior to the incident, it looks like there was a sizeable (~200MW) temporary reduction in consumption in the Gladstone zone … presumably the smelter? Probably entirely unrelated?
Observation #4) Also prior (but closer) to the incident, we see a sizeable (~340MW) increase in consumption in the South-West zone. Not sure why, at this point…
… both observations #3 and #4 via the Powerlink’s ‘Qdata’ service which is an optional extra with ez2view.
1b) The 13:50 dispatch interval
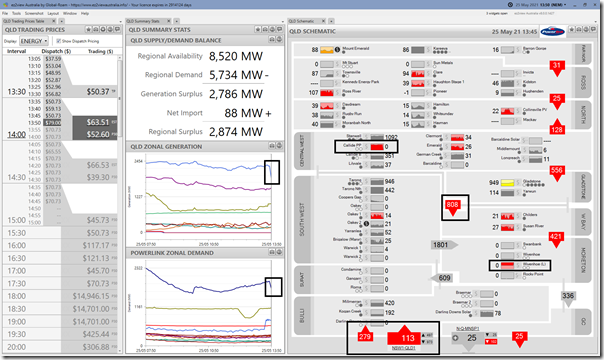
Step forward to 13:50 and we see …
Observation #5) That Callide C4 has also tripped (but note, as above, that they probably occurred very close together):
Observation #6) This loss of supply is reflected in the ‘Zonal Generation’ chart.
Observation #7) We can also see that Wivenhoe pumping stopped (241MW to 0MW) which is also shown in the reduction in Zonal Demand for the Moreton zone.
Observation #8) We can also see that the flow south on the ‘Central QLD to South QLD cut-set’ has reduced significantly (by 319MW):
#8a) From 1,127MW to 808MW as a result of the loss of supply from Callide C.
#8b) Remember that ‘Central to South’ is the aggregation of flows across Calvale to Tarong (i.e. inland) and a coastal line from Gladstone to Wide Bay … and that it was Calvale substation that had issues soon after.
Observation #9) Also noted is that QNI flipped from exporting (QLD to NSW) to importing (NSW to QLD) to help make up the supply shortfall.
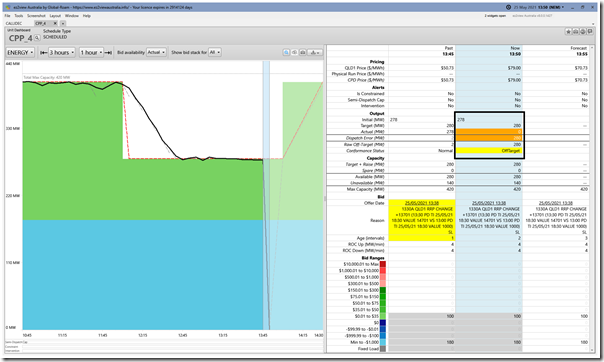
Here’s the CPP4 trip seen in the ‘Unit Dashboard’ widget in ez2view:
All going ‘well’ thus far, but something worse happened subsequently and we don’t really know what…
Event 2 = at ~14:06 (Lots went ‘wrong’ … but several important things went right!)
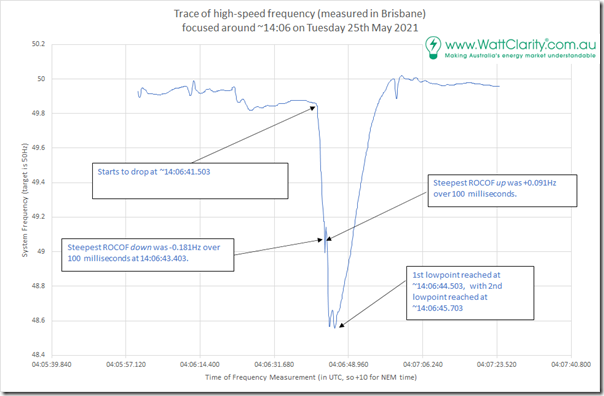
Here’s a ‘zoomed in’ chart of the system frequency focused around 14:06 when the system frequency plunged (almost) calamitously:
I’ve noted on the chart a couple key points … rather than repeating these points, the key ones seem to be:
Observation #11) The low point was double-dipped:
#11a) 48.565Hz at 14:06:44.503
#11a) Then, after a brief (unsustained) recovery to 48.555Hz at 14:06:45.803
Observation #12) Somewhat earlier (14:06:43.503) there was an attempted recovery (with UFLS kicking in, presumably, when frequency hit 49Hz) that could not arrest the decline. At that point, the ROCOF (rate of change of frequency) was steepest:
#12a) It was –0.181Hz over 100 milliseconds.
#12b) Compare that to an aggregate decline through the whole process of 1.3Hz over 4.1 seconds.
2a) The 14:05 dispatch interval
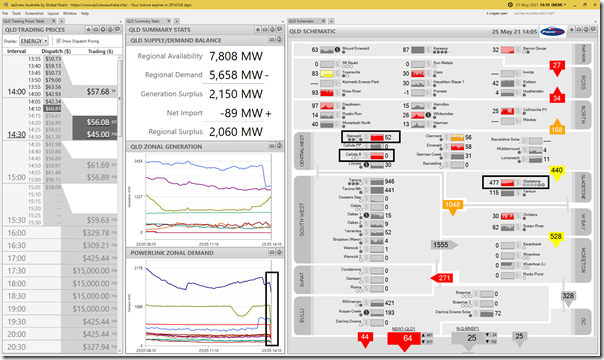
Here’s the snapshot from ez2view for the 14:05 dispatch interval (i.e. before the above major frequency event happened):
There are plenty of other things that readers will be able to observe (e.g. in terms of change in station outputs compared with 15 minutes earlier above) but I will just highlight…
Observation #13) I see (but don’t really understand) that the consumption in Central West is still elevated, though it did wobble a bit.
2b) The 14:10 dispatch interval
Stepping forward to the 14:10 dispatch interval (i.e. after the above major frequency event happens) and we see many other things happening:
From this we see:
Observation #14) Significant numbers of units offline, or significantly reduced load … such as:
#14a) Callide B2 tripped (353MW to 0MW). Note that B1 was already offline on outage.
#14b) Stanwell units all ‘trip to house load’ for units 1, 3 and 4 (with unit 2 on outage).
i. Thankfully the trip to house load made the recovery of demand much quicker afterwards (and supported system strength)
ii. The company noted this success later that day.
#14c) Gladstone units 2, 3 and 4 all tripped (aggregate reduction 679MW).
Observation #15) There was also major reduction in demand, presumably triggered by Under Frequency Load Shedding (UFLS):
#15a) As seen in the chart above, some appears to have fired at 49Hz … but not enough to arrest the decline
#15b) The ‘Powerlink Zonal Demand’ chart shows a major reduction in consumption:
i. in Surat Zone (i.e. presumably for upstream electric compression of CSG)
ii. In Gladstone Zone (i.e. presumably the Boyne Island aluminium smelter).
iii. In Moreton zone (Energex noted ~375,000 customers affected).
iv. Yesterday I saw reports from other zones as well, but they are smaller by comparison (in aggregate – not diminishing the impact caused to any individual!)
We’ll have to wait for more data to understand more of the sequence … but presumably some of the supply side tripped (due to some system disturbance?) which then dropped the frequency and triggered the load shedding.
Event 3 = System Strength constraints ‘constrain down’ Solar Farms (and MEWF1)
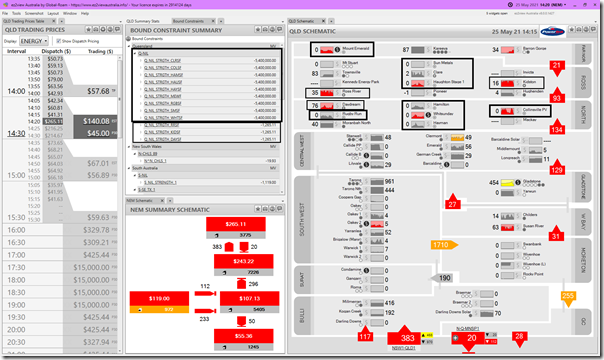
Finally, there was a subsequent event that’s worth flagging in this article (there are a number of others that Allan might also highlight) in that there were a series of constraint equations (unique to each DUID, so unfortunately not visible in real time, except to that participant)
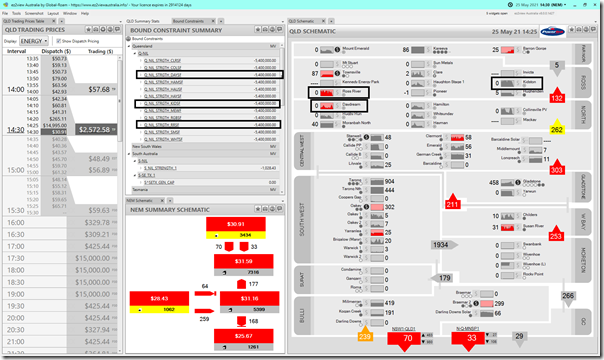
3a) The 14:20 dispatch interval
Here’s a snapshot 10 minutes later (have not investigated why the constraints did not bind for 14:15) showing the series of constraints bound:
Frequent readers will remember constraints of a similar form to these were instrumental in ‘constraining down’ solar farms across northern QLD on Tuesday 13th October 2020, leading to a price spike.
Observation #16) Some 8 x Solar Farms and 1 x Wind Farm were all fully ‘constrained off’ by their own unique System Strength constraint.
Observation #17) For reasons that would be presumably revealed if I reviewed the constraint formulation (which I have not done) the impact on three solar farms (Ross River SF, Kidston SF and Daydream SF) was more modest in this dispatch interval. Not sure at this point.
3b) The 14:30 dispatch interval
Skipping 14:25 we head to 14:30 and see the situation has progressed:
Observation #18) At this point, the Marginal Values of the other 3 constraints has also increased and the 3 other Solar Farms have been ‘Constrained Off’.
That’s all I have time for now!


Paul,
It may not be generally known that most modern generators are hydrogen cooled so it is possible that it was a hydrogen explosion that was reported as preceding the trip (I believe). I think that is unlikely as there were no casualties, though this may just be a matter of luck (everyone at smoko). Another source of explosion are pipes containing steam which hopefully would only have been a small line e.g. a drain or instrumentation line. Loss of an instrumentation line may effectively cause a false signal to the turbine control systems leading to a trip. All speculation of course at this stage but any explosion in a power station is a worry.