A short article today sandwiched between this longer article for Part 3 and another longer one (to come) for Part 5.
(A) Recapping what happened on Sunday 24th January
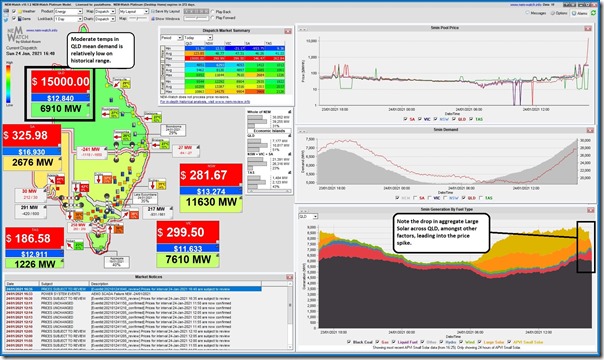
As we noted on the day (Part 1) the QLD price spiked high in the 16:35 (to $2,173.06/MWh)and 16:40 (to $15,000/MWh) dispatch intervals – here’s the 16:40 dispatch interval captured in NEMwatch v10 at the time:
We determined that the ‘Q>>NIL_CLWU_RGLC’ constraint equation rapidly reduced the output of many generators in QLD of varied fuel types. The resultant drop in supply meant that prices could only go one way – up, and quickly!
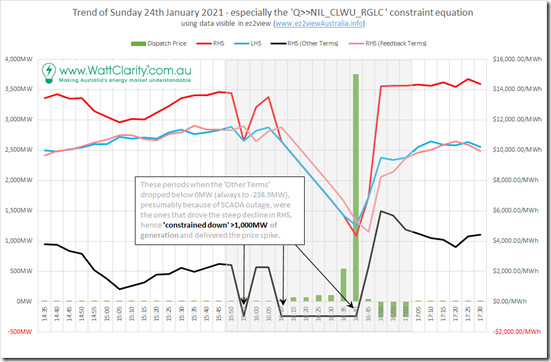
On 15th February 2021 the AEMO published a ‘Preliminary Report – Total loss of SCADA systems on 24th January 2021’, in which they communicated a number of things – including that the SCADA outage lasted from 15:46 through until 16:56 (both NEM Time). With the AEMO preliminary report as a guide, in this longer article for Part 3 I was able to unbundle the RHS terms of the ‘Q>>NIL_CLWU_RGLC’ constraint equation into two groups:
Group 1 = RHS (Feedback Terms); and
Group 2 = RHS (Other Terms).
…. both of which were trended in the chart below:
What seemed to be the case, from this analysis, was that there were several dispatch intervals (15:55 and then 16:10-to-16:40) in which the ‘RHS (Other Terms)’ dropped sharply below zero (always to –238.9MW), which had the effect of:
Step 1 = drag the LHS lower; hence
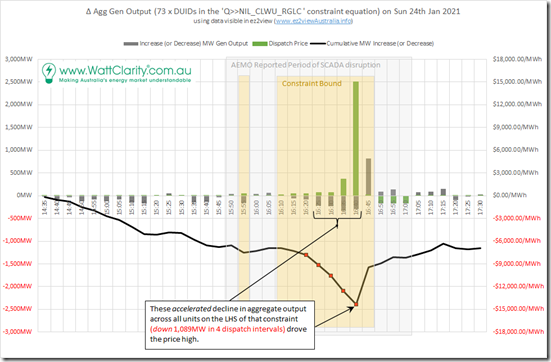
Step 2 = by virtue of their membership of the LHS, drag the targets of many QLD generators lower – with the growing deficit (down 1,089MW in 4 dispatch intervals to 16:40) shown in the chart below:
What was not clear when we prepared this longer article for Part 3
(B) Unbundling ‘RHS (Other Terms)’
We noted last time that the ‘RHS (Other Terms)’ was constituted as follows:
RHS (Other Terms) = 3.935 x (
Qld: 8875 Raglan-Larcom Creek 275kV Emergency Rating
– MVA flow on 8875 275kV line at Raglan
– 0.4235 x [MVA on 871 275kV feeder from Calvale, Line end switched MW]
– 30 {Operating_Margin})
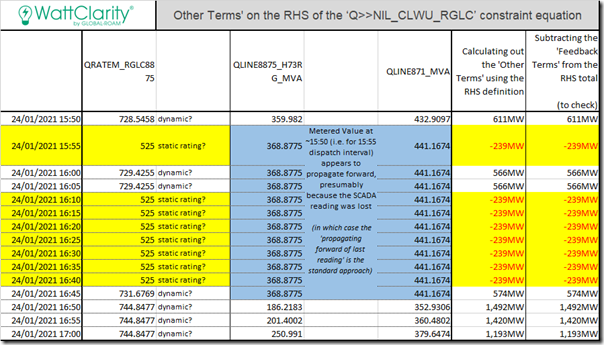
Thanks to a few keen readers for pointing us in the direction of where we could go to unbundle the 3 variables contained within this formula, which we present in the following table:
Because of the multiplier (3.935) on the equation, we can see that a reduction of 203 (i.e. 728-525) in the emergency rating on the Raglan-Larcom Creek 275kV line (i.e. line 8875) flips the ‘RHS (Other Terms)’ value from above 500 down to –239.
(C) What’s next, in Part 5?
The next article (when we have it finished) will probably be a fair bit longer, as we intent to review what happened with all 74 terms on the LHS of this equation (i.e. the DUIDs + QNI dispatch target) that was affected by the large clamp placed on the collective output by virtue of the effect above. We’re quite interested to understand such things as:
1) The sequence by which they were ‘dispatched down’ (taking into account both the LHS factor and also how they bid);
2) What the 4-second SCADA data says (to the extent that it is present) about what actually happened with output – as distinct from what AEMO assumed in their InitialMW through the period where SCADA disruption was noted; and
3) What efforts were made (e.g. through bidding behaviour) to change the dispatch outcomes … especially given that (it appears in hindsight) the price spike at 16:40 was almost guaranteed to happen whilst the SCADA outage continued.
(D) A reminder – why do we complete analysis like this?
There are a number of reasons why we engage in forensic analysis like this particular one – including these two big reasons. This event, in particular, has already revealed a couple of things we can do in our ez2view software to continue to enhance its capability – which we’ll look forward to delivering as part of the move towards version 9.1 and then into the future…
Of course, if you could help us in these ways (or know of people who can help us) please let us know? Such a person would potentially also be able to help us with the mammoth analytical task that is GenInsights21!


Leave a comment