Through a number of conversations recently with a variety of people I’ve been wondering about how the changes washing through the physical market are having flow-on effects on the financial mechanisms that wholesale participants use to hedge their exposures.
One question that has arisen, in several conversations, has been the effect on traded volumes for traditional ‘peak’ contracts. Are these contracts increasingly becoming irrelevant (or, at least, increasingly difficult for any company to be the natural supplier of)?
(A) What’s happened to traded volumes of peak contracts?
Our NEMreview v7 application provides access (via the NEMFuturesUpdater) to end-of-day Price, Volume and Open-Interest for BASE, PEAK and CAP contracts that have traded on the ASX. This same data is also in the ez2view ‘Trends Engine’.
Whilst I have occasionally looked at pricing for these contracts (sometimes making its way into articles like this one on Q2 pricing till 2020) I have almost never looked at traded volumes. Hence on this occasion I thought I would strap on my ‘L plates’ (reader beware!) and take a look at what I could see. Whilst our history of prices runs back to early 2002, I see that our history of volumes traded has been compiled only as far back as the start of 2016 … but that 5 year history is probably enough to reveal what seems to be some changes…
(A1) NSW Region
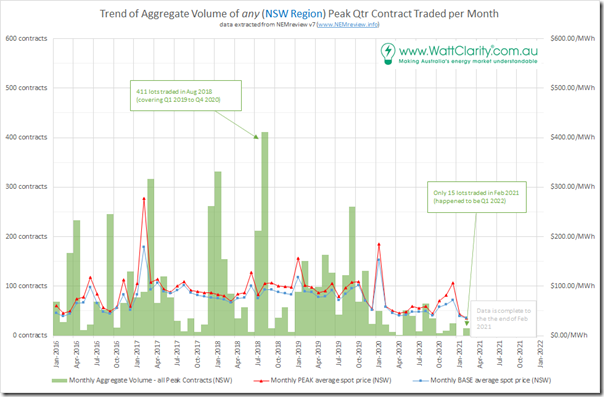
Let’s start with the NSW region, showing the data for traded volumes that we can extract from NEMreview v7:
To clarify what’s in the green bars, they total the number of contracts traded in that month for any Quarter Peak contract in the NSW region. Keep in mind that:
1) a contract is for 1MW for the contracted Quarter during ‘peak’ times, and that
2) the numbers are of any Quarter contract (with contracts being listed to trade for the current quarter, and for quarters a couple years forward from ‘now’).
3) Also, where a trade might have been for the whole of calendar 2019 (say) this is represented as 4 contracts (in that case for Q1, Q2, Q3 and Q4 2019).
With the numbers presented in the chart above, I have highlighted both:
1) August 2018, where we see the highest volume traded (411 contracts) over the 5-year window for which we have data here; and also
2) An aggregate volume of only 15 contracts traded in February 2021.
It does seem clear that (at least for NSW) volume of peak contracts traded in NSW have dropped.
—————-
Also worth noting the spike in monthly average prices in NSW for February 2017 (and significant separation between BASE and PEAK average), which would have been driven (at least in part) due to the extremes of Fri 10th Feb and Sat 11th Feb 2017. In the historical articles on WattClarity, readers will also be able to find other factors contributing to other volatile months.
(A2) QLD Region
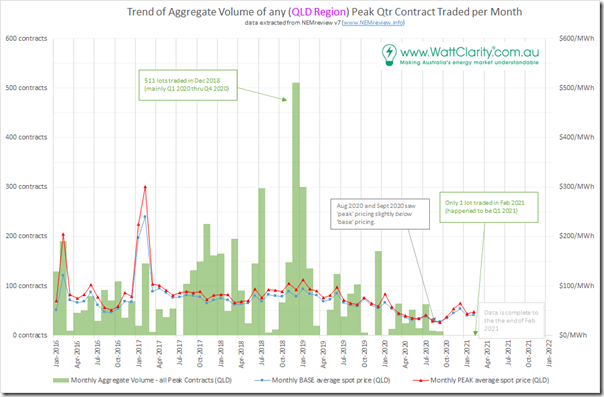
Stepping north into the QLD region, we see a similar pattern, with volumes lower for the past 18 months or so:
Highest volume traded in a month was in December 2018 at 511 lots – so higher than the highest month seen in NSW in the past 5 years.
———-
In terms of peak price outcomes, February 2017 stands out as well for QLD (like for NSW above – but even moreso given the Government’s prior ‘don’t make so much money’ mandate to its two existing generators at the time following these three reasons in July 2017 why QLD prices had spiked).
(A3) VIC Region
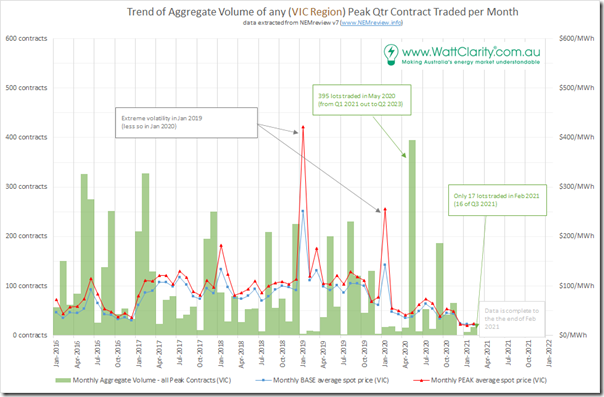
Skipping down to the VIC region, what we see is a little more ambiguous (in terms of a ‘peak contracts are less traded now’ story):
As late as Sept 2020 we see a relatively high number of contracts traded – and this was also only 4 months after the highest trading month (May 2020) seen in the 5-year span.
———-
In terms of peak price outcomes, there were volatile outcomes seen in January 2019 and January 2020.
(A4) SA Region
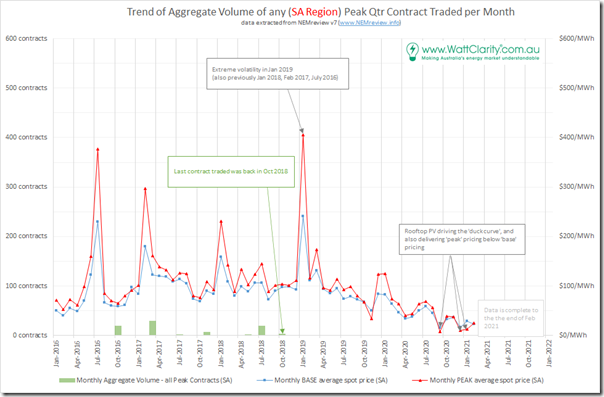
In contrast to the three regions above it’s clear that there is much less volume traded (i.e. almost zero) in the South Australian region:
———-
In terms of peak price outcomes, there were volatile outcomes seen in January 2019 (and also in January 2018, February 2017 and July 2016).
(B) General comments about ‘Peak’ contracts
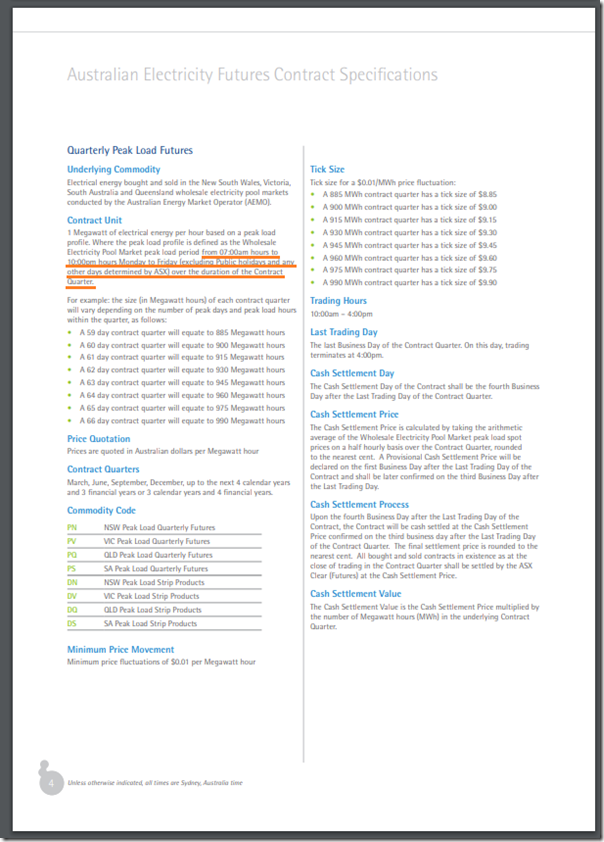
Page 4 of the ASX’s Contract Specification document (July 2015) reiterates that what has been traditionally defined as the ‘PEAK’ period is between 07:00 and 22:00 (NEM time) on working weekdays (i.e. Monday to Friday, excluding Public Holidays for the region):
That’s always been a pretty broad time range that’s not really coincided with the far narrower time ranges that have encapsulated the rarer events with extreme levels of demand. It’s more traditionally just related to types of commercial and industrial load that might run ‘two-shift’ during working weekdays (i.e. shutting down between ~22:00 and ~07:00 the next morning).
However the growth of the (rooftop PV induced) ‘duck curve’ phenomenon has meant that:
1) In some regions in particular, we are reaching the point where Operational Demand (or ‘Grid Demand’) has been lower than Grid Demand outside of those sunlight hours, and sometimes even in the middle of the night;
2) This change in demand pattern has been one of the primary drivers of the increased incidence of negative prices through sunlight hours …
(a) which has also delivered (as noted above) some recent months where calculated ‘Peak’ Prices have actually been below calculated ‘Base’ Prices.
(b) We can see some of this in the charts above for some regions – and I’d be expecting to see more of this in future (perhaps overlaid onto the changing dynamic when the next coal units close).
(c) It’s also the reason why Feed in Tariffs offered (or mandated) have been reducing for some as well noting other recent announcements (here in PV Magazine for VIC and here in RenewEconomy for NSW).
(C) Additional information from Adour – Energy Advisory
One of the people who I spoke with about this was Tiburce Blanchy of Adour – Energy Advisory (Tiburce also contributed an article here about ‘Retail Energy – not so easy’ back in October 2018).
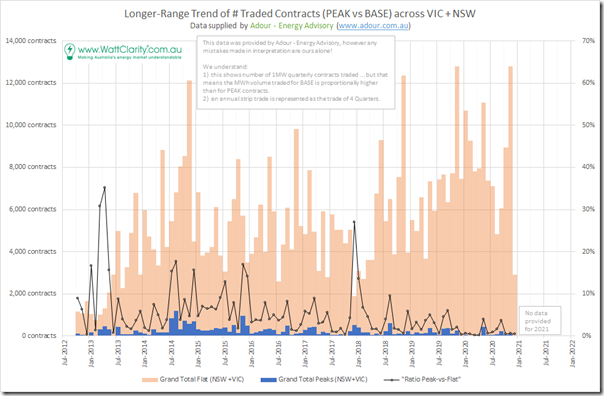
Tiburce has assembled a greater depth (and duration) of data than we have accessible in NEMreview v7, and has graciously shared some data with me such that I can create the following trend – which again is only a monthly trended basis as above:
Readers should continue to exercise caution in reading the chart and any comments I make, as any errors there are entirely mine (and I do have ‘L’ plates on).
What I think this shows is that:
1) Volumes of peak contracts have been declining;
2) However this has been off an already low relative base, when compared to the volume of BASE contracts traded.
(a) On rare occasions, when the volumes of BASE contract were low (e.g. December 2017) the ratio of the two types of contract spike
(b) But (other than those instances) the ratio has almost always been below 10% … and in the past 2 years well below.
(c) For reasons not explored here, volumes of BASE contract traded increased from 2019, which has also driven the ratio down.
(D) New approaches to hedging emerging
Back in June 2018, Dave Guiver wrote here about ‘New hedging options emerge in the NEM as the energy transition accelerates’ – in particular with respect to a ‘Solar Profile’ product, and a ‘Solar Firming’ product.
In January 2021, we saw quite a few articles written about a ‘virtual storage’ deal arranged between ERM Power, Macquarie Group, Hydro Tasmania and Renewable Energy Hub – with coverage including in the AFR, RenewEconomy, PV Magazine, Energy Magazine, Smart Energy International and elsewhere (a fuller list tagged into the growing Asset Catalog).
This hedging arrangement, in particular, was discussed by Caroline Wykamp on 8th April on WattClarity as a ‘game changing energy deal’.
We’ll be interested to see what other types of hedging emerge in the future…


Be the first to comment on "Will the traditional ‘Peak’ contract be another casualty of this Energy Transition?"