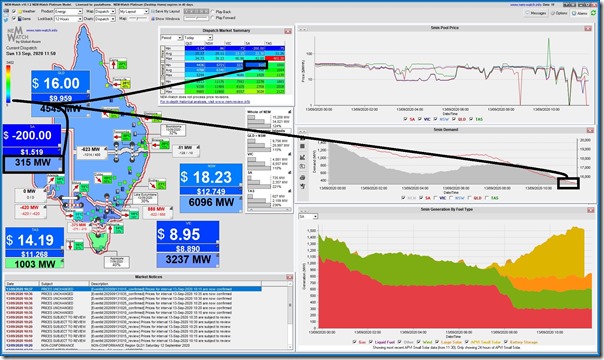
Today (Sunday 13th Sept 2020) another record seems to have fallen. Here’s a snapshot of the 11:50 dispatch interval taken from our NEMwatch v10 entry-level dashboard showing Scheduled Demand down at 315MW:
When measured on the basis of ‘Scheduled Demand’ this point appears to be, on quick scan, the lowest point experienced in the 22 years since the start of the NEM (excluding the period around the SA System Black).
Interesting that whilst rooftop PV is supplying a large amount (eating away from ‘Underlying Demand’ to deliver low ‘Scheduled Demand’) and 3 x Large Solar Farms in SA (Tailem Bend SF, Bungala 1 SF and Bungala 2 SF) are performing strongly, most of the wind fleet is not producing – which I suspect is because they are being ‘dispatched down’ with the low prices, not a lack of wind. Today’s low (but not record) demand in VIC means that the constraints between VIC and SA are probably not leading to outcomes that would be all that different if those interconnectors were not constrained.
Note 1) It’s only really Lincoln Gap Wind Farm that seems to be running strongly at the time in this snapshot;
Note 2) Details visible in ez2view, but not shown in snapshot here to save space;
Note 3) Tailem Bend Solar Farm dropped offline in the 12:10 dispatch interval following a similar –$200/MWh dispatch price at 12:05. Don’t have enough data at this point to ascertain if via ‘Paradigm 1’ or ‘Paradigm 2’ behaviour.
Note 4) Lake Bonney 2 WF and Lake Bonney 3 WF have been bouncing up and down in response to price (we saw that two weeks ago on Saturday 29th August they appeared to be using ‘Paradigm 2’ behaviour).
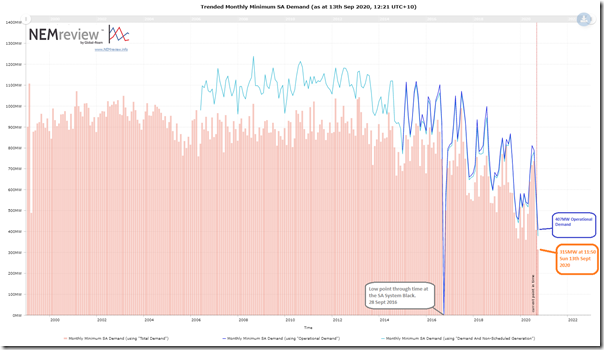
We can see the low point in Scheduled Demand in this trend query produced from NEMreview v7 showing data until 12:21 today:
We can see that today’s low point was noticeably (-45MW) lower than the prior low point (360MW) reached on 9th March 2020 which itself was lower (only -7MW) than the preceding low point, which was set on Sunday 3rd November 2019.
Note that the AEMO more recently speaks of demand in terms of ‘Operational Demand’, which is published on a 30-minute basis (not 5-minute basis) and could be thought of in terms of ‘Grid Demand’. The other measure shown there is ‘Demand and Non-Scheduled Generation’ which is a reasonably close proxy for Operational Demand:
(a) which is also published on a 5-minute basis;
(b) and has forecasts published (P5 and P30) by AEMO;
(c) hence we sometimes label interchangeably for Operational Demand.
Whilst Operational Demand is a better representation of what’s been consumed from the grid, a number of market participants still prefer to talk in terms of Scheduled Demand, and this relates more closely to the prices that are set in the market (hence is sometimes called ‘Market Demand’). The much longer-form explanation of all of this is here.
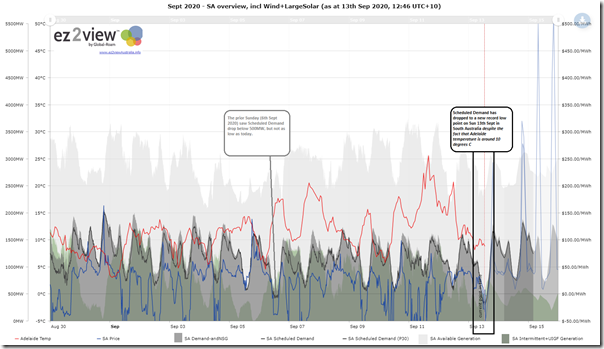
Here’s a ‘zoomed in’ trend view using ez2view Trend Engine that shows the past two week period:
We can see that the Scheduled Demand today in South Australia has hit a lower point than the prior Sunday (6th September – day of the new low point in VIC) despite the fact that the apparent temperature’s only around 10 degrees at the current point in time in Adelaide, which might (I’m guessing) have led to a bit of electric heating still through the day in South Australia?


And then the sun went down and scheduled demand rose like a ducks head just in time for dinner.
All the wind and solar generation in the world won’t help if they can’t produce supply when there is actual demand.