Whilst I’ve been partly stuck in the past over the prior week, starting to forensically review extreme events in 2013, 2014, 2015, 2016 and 2017 as part of this list of extremes in collective under-performance or over-performance across all Semi-Scheduled (i.e. Wind and Solar Farm) units, I’ve also been keeping half an eye out
In the middle of the day today in Brisbane I noticed two things in particular:
1) It’s come over very bleak in my part of Brisbane; and
2) Guest author on WattClarity and CTO at Solcast, Nick Engerer started this interesting discussion on LinkedIn, which (for those who don’t have access) I have taken the liberty of copying in here, as I am sure that Nick won’t mind:
#renewablenergy case study today?
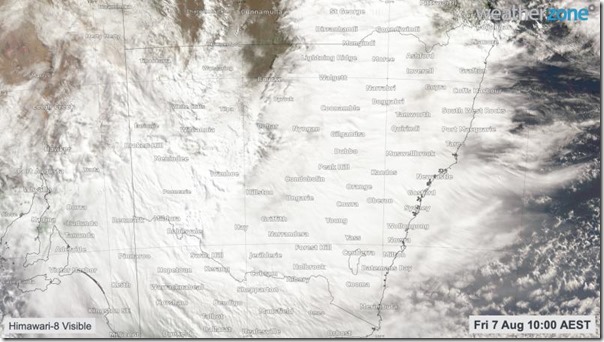
Australia is experiencing quite a unique synoptic scale low pressure system, triggered originally by a cold pool of air all the way from the Antarctic latitudes. The resulting cloud cover today is very widespread, and represents a unique case study for #solarenergy.
NSW is operating at about 10% of its total solar capacity (rooftops) and VIC at less than 20%. In the attached three images, you can see the cloud cover (via Weatherzone) and the total generation from rooftop solar in NSW/VIC today. Numbers & images are courtesy of the Solcast (Solar Radiation Data Experts) API Toolkit
Similarly low outputs are occurring from VIC/NSW utility scale solar farms. For example, the ~100MW Nyngan solar farm is was as low as 3-11MW over most of this morning.
#windenergy in NSW is presently at a capacity factor of approximately 60% while this is occurring, as winds are not particularly strong in the north and central parts of this weather system.
I will throw a link in the comments where you can check the solar irradiance resource around the region today for your own investigation!
What I found particularly useful was this image of cloud cover from WeatherZone that Nick included in his discussion starter there:
Helps to illustrate the scale of the weather system!
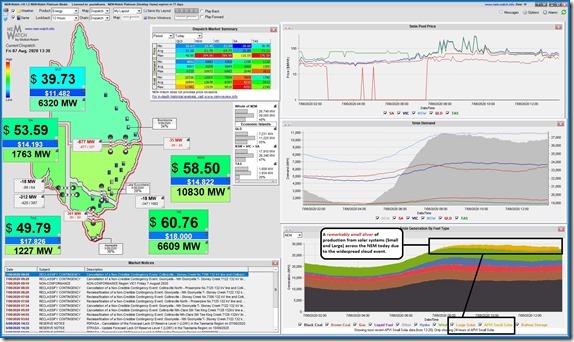
Here’s a snapshot of what we can see from a market perspective in the 13:40 dispatch interval via the NEMwatch v10 entry-level dashboard. I can’t remember when was the last time we saw such a small sliver of solar (both small and large) in the middle of a day!
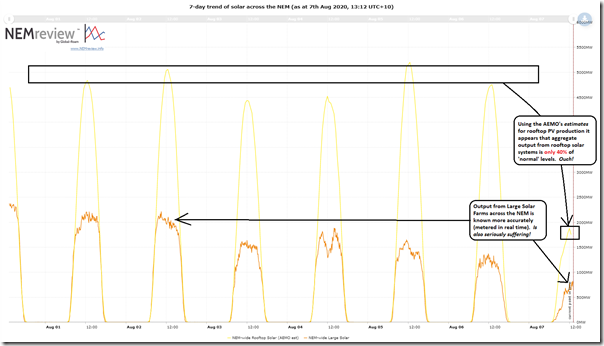
Using this trend query I quickly knocked together in NEMreview v7, we’re able to get a quick sense of how we’re doing today across the NEM compared with the 6 preceding days.
Notwithstanding the challenges about the opacity of rooftop PV systems, we’re able to use AEMO’s estimates here as a general guide to see that there’s been a massive reduction in injections from rooftop systems NEM-wide through the day today compared to prior days:
1) As noted on the chart, they are down to 40% of every other day this week;
2) Note that I chose to use AEMO estimates here whereas NEMwatch uses APVI estimates (they are not identical, and the APVI estimates typically imply a larger impact of cloud/rain events like these ones). Not sure which one is actually more correct.
The cloud cover is also (obviously) affecting output from what’s now a fairly widespread base of Large Solar Farms across all mainland regions in the NEM now (though concentrated in Queensland). Note that the weather map above does not extend to show much of Queensland.
As we see in NEMwatch there is a reasonable band of green (i.e. wind production) running over the past 24 hours.
In more general terms, will mentally bookmark this day as one to come back to whenever we get the chance to explore ‘stress testing’ of scenarios for larger adoption of wind and solar capacities as the energy transition rolls on…
—————–
PS – there’s a nice animated image of a broader weather map attached to Nick’s tweet here as well


This is only going to get more and more common as the magnetic south pole shifts further north.
It has already exited Antarctica and is on it’s way towards south western australia.