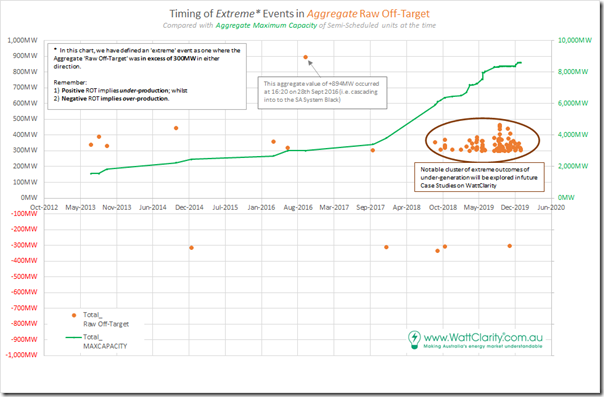
This is now the 9th Case Study in a series, with each looking at one or more of the 98 discrete Dispatch Intervals (2013 to 2019) identified as having extreme outcomes for aggregate under-performance or (more rarely) over-performance across all Semi-Scheduled plant:
1) We’re using the Aggregate Raw Off-Target measure, which we analysed across 2019 in our Generator Statistical Digest 2019, and have embedded into our ez2view software.
2) We’re specifically looking at values greater than 300MW:
(a) Of the 98 dispatch intervals, only 5 were of collective over-performance;
(b) Hence the remaining 93 dispatch intervals were of collective under-performance.
3) The first 8 Case Studies covered 2013, 2014, 2015 and 2016, whilst this 9th (and this 10th – to come) Case Study will also cover 2017.
(a) The bulk of the incidents ran from September 2018 through to December 2019 – noting we’ve not yet looked into 2020 data, which will be the focus of the GSD2020:
(b) There is a clear escalation in extreme variability, and we’re walking through these Case Studies in order to understand why and what the implications are of this.
4) We’re doing this given a push from the AER Issues Paper, but moreso inspired by the deliberations by the (now defunct) COAG Energy Council and (under threat?) ESB relating to ‘NEM 2.0’.
—————–
… so let’s look at this particular event:
(A) Summary results for Thursday 5th October 2017
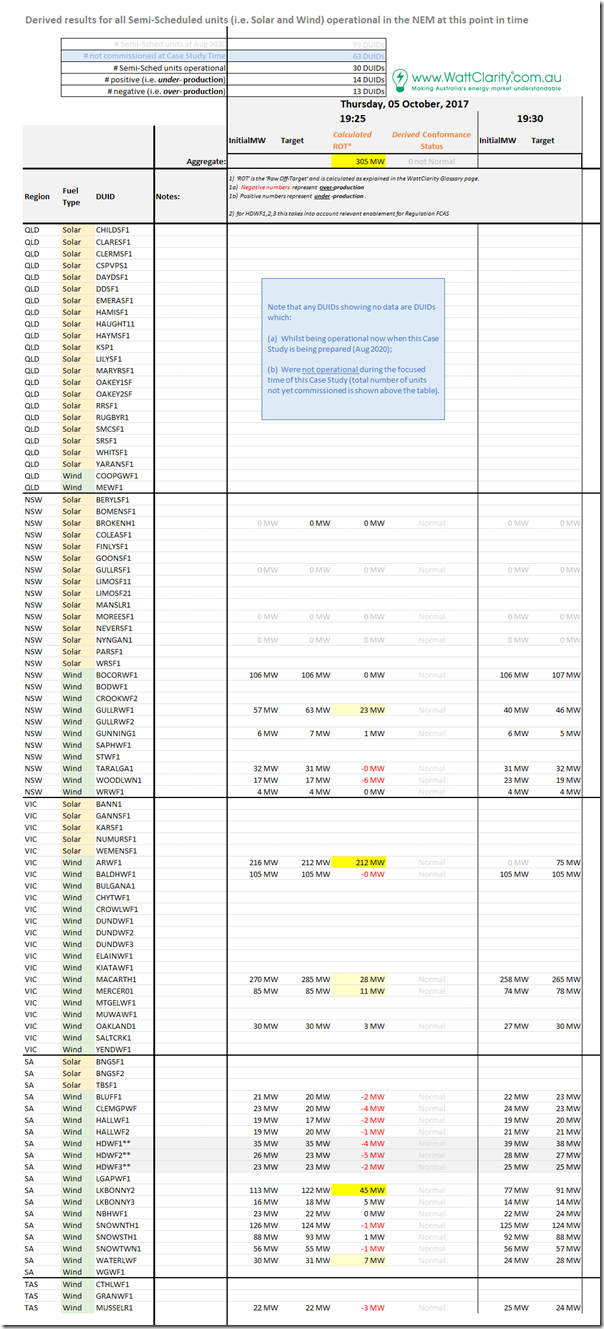
Again, we start with this summary table, highlighting the individual Raw Off-Target performance of all Semi-Scheduled units that were operational at the time:
There’s a few things that can be highlighted here:
1) This period sees 30 DUIDs registered in total at this point in time:
(a) 4 of these are Solar Farms;
(b) So the remaining 26 are Wind Farms.
2) Across all of the DUIDs:
(a) 3 played no role (probably not operational)
(b) 14 DUIDs were under-producing, whilst 13 DUIDs were over-producing (i.e. in this case, almost even – which does not seem to happen too regularly in the samples we’ve looked at to date).
(c) Interestingly, there was a cluster of 9 wind farms in South Australia over-producing (i.e. negative Raw Off-Target), but in all cases only slightly so.
(d) In contrast, there are 5 Wind Farms significantly under-producing (the ARWF1 particularly so in this instance).
(B) Looking at some specific DUIDs
… and so we will explore each of these below, working top-to-bottom on the table. Again we can show this specific dispatch interval clearly with the ‘Unit Dashboard’ widget in ez2view, wound back 3 years ago through the powerful ‘Time Travel’ functionality:
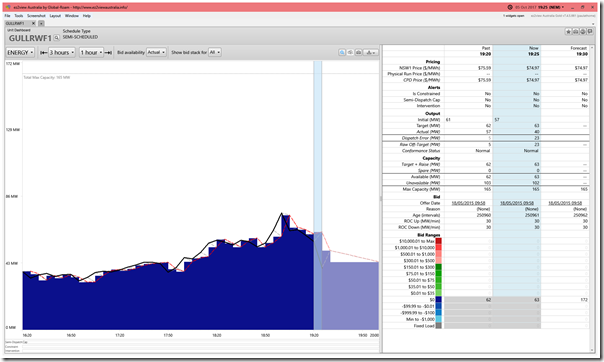
(B1) Gullen Range 1 Wind Farm in NSW
We see the GULLRWF1 was over-performing by 23MW:
(B2) Ararat Wind Farm in VIC
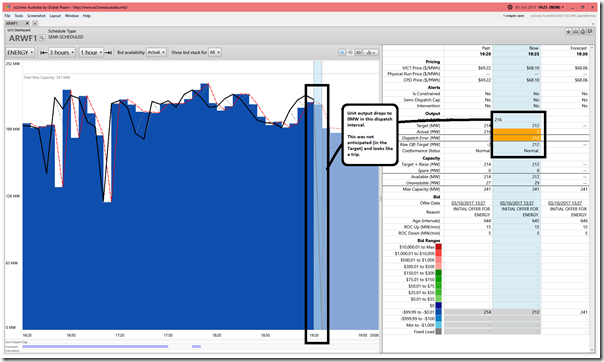
ARWF1 was clearly the largest contributor (+212MW) to the aggregate under-performance across the Semi-Scheduled group of units (+305MW in total):
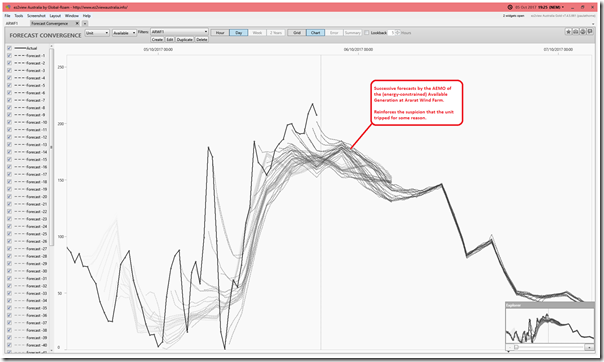
It seems here that the unit tripped for some reason. A large reduction like that was certainly not forecast ahead of time in the AEMO’s P30 predispatch forecasts for the wind farm’s (energy constrained) Availability – as we can see from the ‘Forecast Convergence’ widget in ez2view focused on ARWF1 at the same point in time:
(B3) Macarthur Wind Farm in VIC
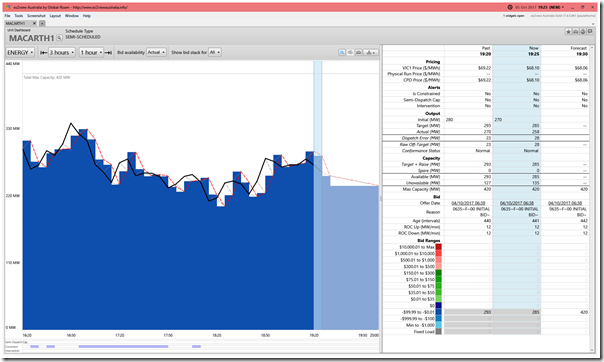
We see at MACARTH1 (a frequent entry in these Case Studies, not least of which because of its large size) that the unit under-performed by 28MW.
The snapshot shows that deviations of around that much had been a frequent occurrence over the (3-hour) ‘look back’ selection in the window.
(B4) Mt Mercer Wind Farm in VIC
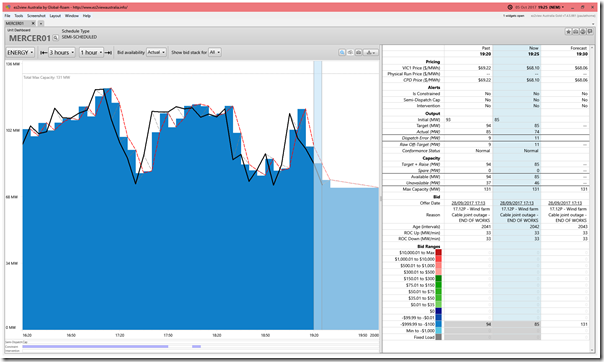
The MERCER01 DUID shows an under-performance of 11MW
(B5) Lake Bonney 2 Wind Farm in VIC
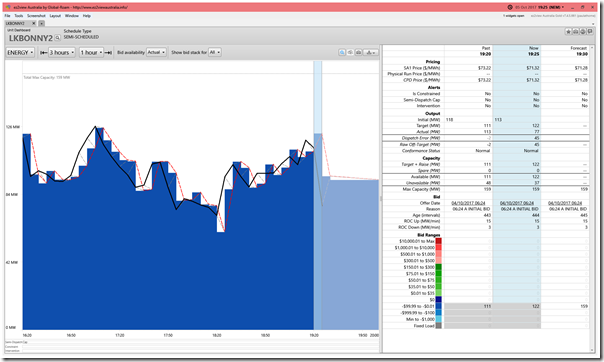
This was the second largest contributor (at +45MW – again an under-performance):
——-
It’s worth noting in conclusion here that these 5 DUIDs were spread across a reasonably wide area of NSW, VIC and SA and that there was no unit that significantly over-performed at the same time to balance out the under-performance. Worth keeping in mind, with respect to what the implications might be into the future….


Leave a comment