A short – and perhaps disjointed – article this afternoon to note a number of overlapping events that we’ve seen in the Queensland region through today (Friday 1st May 2020).
(A) Spot prices drop into negative territory
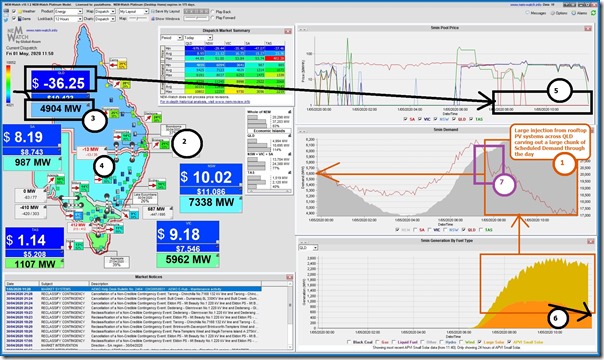
Here’s a snapshot taken from our NEMwatch v10 entry-level dashboard capturing the state of the market at 11:50 today
Following the numbers added to the display we’ll walk through a number of things that were evident at that time:
1) We see a large production from rooftop PV systems across the state (with APVI estimates shown here in the NEMwatch software) eating into Scheduled Demand via the ‘duck curve’ phenomenon.
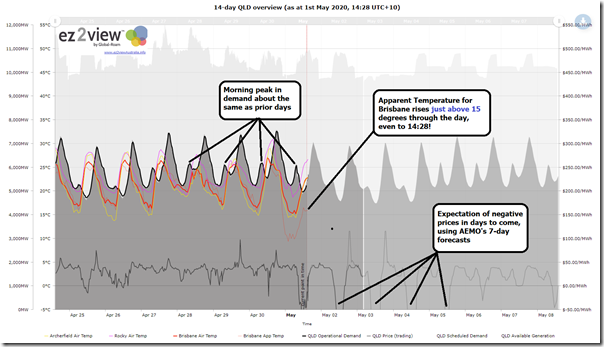
2) Additionally today, we see that temperatures have dropped (at least by northerner standards!) as the cold front that has brought snows to NSW and VIC arrived in south-east Queensland. Whilst not cold enough to drive much in the way of heating demand, it has inevitably reduced electricity consumption for space cooling. We can see from the trend of apparent temperatures in Brisbane over the past 7 days how different this day has been from the prior six days:
Clients with their own access to ez2view can access this trend online here.
3) The combination of these factors has driven the Scheduled Demand down – to a low point at 11:50 shown above in the NEMwatch snapshot that’s definitely down in the blue zone compared to the historic range. In contrast it’s colder in NSW and (even moreso) in VIC and TAS, which is one factor driving demand higher there (to light blue and green).
4) This low Scheduled Demand level has been exacerbated (in terms of price outcomes):
(a) by the oodles of available generation across all Scheduled and Semi-Scheduled plant in the QLD region (including strong production from Large Solar) but also
(b) quite severely by the much more limited export capability south over the QNI interconnector (discussed below)….
5) This has driven QLD spot price outcomes through the floor for much of the day.
6) Which appears to, in turn, led to what might initially be a counter-intuitive scenario highlighted in the NEMwatch snapshot from as early as 11:50 where contributions from Large Solar aggregated across Queensland were significantly declining so early in the day. Whilst local cloud cover might have been part of the issue, it’s almost certain that some of this will have been whilst solar farms were rebidding (or already positioned) to be dispatched down by the AEMO in order to avoid the negative prices.
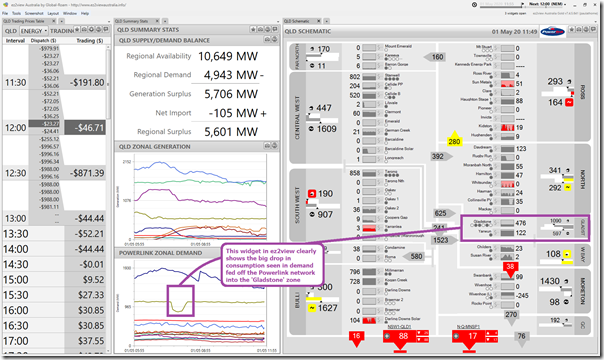
7) Finally, it’s also worth highlighting the significant (approx 300MW) drop in Scheduled Demand for about a half hour or so early in the day – using the access to Powerlink’s QData feed that is possible (and visible) through ez2view, we can see that this reduction occurred in the ‘Gladstone’ zone, which reinforces a suspicion that it might have been something happening at the aluminium smelter:
(B) Three specific notes
Running out of time today, but just wanted to note the following three things:
(B1) Transmission Outage affects QNI since Thursday
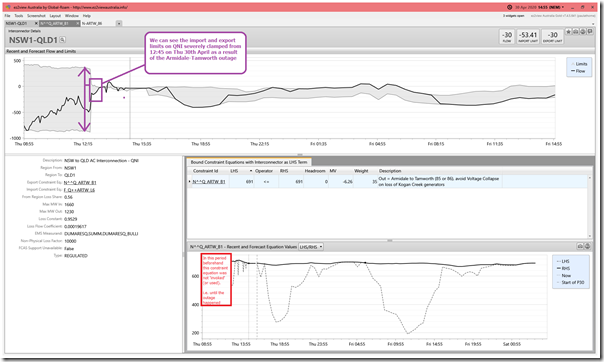
Exports are constrained on QNI because of a transmission outage occurring in northern NSW – as can be seen in this snapshot from ez2view Time-Travelled back 24 hours to yesterday afternoon.
We can clearly see the export and import limits severely clamped on QNI from 12:45 on Thursday, as a result of the outage.
PS 1 Reason for the Outage
Thankfully, Geoff Eldridge on Twitter has helpfully pointed us at this update by TransGrid that notes:
“Emergency crews are mobilising to restore part of the Queensland NSW Interconnector damaged by strong winds in Tamworth this week – strong winds knocked down the high voltage assets”
Shades of what happened to Heywood on 31st January.
Worth noting that decision was made to protect the region in case Kogan Creek (the largest unit) trips, which would otherwise trigger voltage collapse in the QLD region (not the same failure mode, but the same outcome – in terms of limiting transfers – that would have gone a long way to preventing the SA System Black had the same thing been done to Heywood on that fateful day).
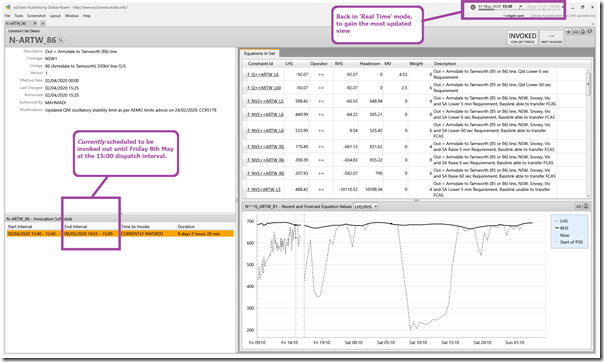
Now these two constraint equations (and others) are all part of the ‘N-ARTW_86’ Constraint Set, which we can see in the relevant widget in ez2view is currently scheduled to be invoked out until Friday next week:
Given that that this outage (hence reduced export capability) is one of the main reasons why it seems likely that prices will experience significant periods underwater for the coming 7 days.
(B2) Large Solar plant operate as yo-yos
As we’re within the current day we can’t see generator bids (or dispatch targets and the like) but we suspect that there are a number of solar farms bidding in order to get themselves away from the cost of generating with prices underwater. The red (i.e. large change) colour coding for four of the solar farms in the 11:55 dispatch interval snapshot above in ez2view highlights some of the movements in their outputs (other variations are easily visible, as well).
(B3) Non-Conformances – for reasons unknown at this point
Frequent readers here at WattClarity will understand that we’ve invested considerable energy in building out the functionality to view ‘Raw off-Target’ in our ez2view software – and also made it a feature of reviewing operational performance of all (Scheduled and Semi-Scheduled) DUIDs through calendar 2019 in our Generator Statistical Digest 2019.
For instance, on 28th January 2020 I shared freely here some of the insights that jumped off the page in reviewing the GSD2019 when grouping to fuel type. Note the particular performance of Large Solar as an asset class in the headline summary in that page.
Now ‘Raw Off-Target’ is not synonymous with ‘Conformance Status’, but is a building block into determining this. Which is why it was of interest to see this afternoon already two different Large Solar Farms in QLD identified in AEMO Market Notices
(B3a) Yarranlea Solar Farm Non-Conformance
Firstly, in Market Notice 75534 the AEMO notes that the Yarranlea Solar Farm was non-conforming for 90 minutes late this morning:
___________________________________________________________________________
Notice ID 75534
Notice Type ID Details of Non-conformance/Conformance
Notice Type Description MARKET
Issue Date Friday, 1 May 2020
External Reference NON-CONFORMANCE Region QLD1 Friday, 1 May 2020
___________________________________________________________________________
AEMO ELECTRICITY MARKET NOTICE
NON-CONFORMANCE QLD1 Region Friday, 1 May 2020
AEMO declared a schedule generating unit non-conforming
Unit: YARANSF1
Duration: 01/05/2020 10:40 to 01/05/2020 12:10
Amount: 52 MW
Constraint: NC-Q_YARANSF1
Auto-generated on behalf of Manager NEM Real Time Operations
If time permits, I’d be interested to delve in further (at a future point in time) as a Case Study here.
PS2 on Monday 11th May 2020
The Case Study with respect to the Non-Conformance of Yarranlea Solar Farm has been published here on Monday 11th May 2020.
(B3a) Clermont Solar Farm Non-Conformance
Thirty minutes afterwards, Market Notice 75535 pointed at Clermont Solar Farm:
___________________________________________________________________________
Notice ID 75535
Notice Type ID Details of Non-conformance/Conformance
Notice Type Description MARKET
Issue Date Friday, 1 May 2020
External Reference NON-CONFORMANCE Region QLD1 Friday, 1 May 2020
___________________________________________________________________________
AEMO ELECTRICITY MARKET NOTICE
NON-CONFORMANCE QLD1 Region Friday, 1 May 2020
AEMO declared a schedule generating unit non-conforming
Unit: CLERMSF1
Duration: 01/05/2020 11:35 to 01/05/2020 13:20
Amount: 61 MW
Constraint: NC-Q_CLERMSF1
Auto-generated on behalf of Manager NEM Real Time Operations
Again, scope for a focused Case Study on this one.
PS3 on WHEN?
The Case Study with respect to the Non-Conformance of Clermont Solar Farm has not been completed yet. When it is completed, it will be linked in here.
… but that’s all I have time for today


Thanks Paul. Fantastic coverage of the situation.