
Widespread and heavy rainfall occurred across southeast Queensland during the week ending Sunday 27th February, 2022.
The deluge produced some of the highest rainfall totals on record.
Tweets such as this one highlighted the magnitude of the weather event: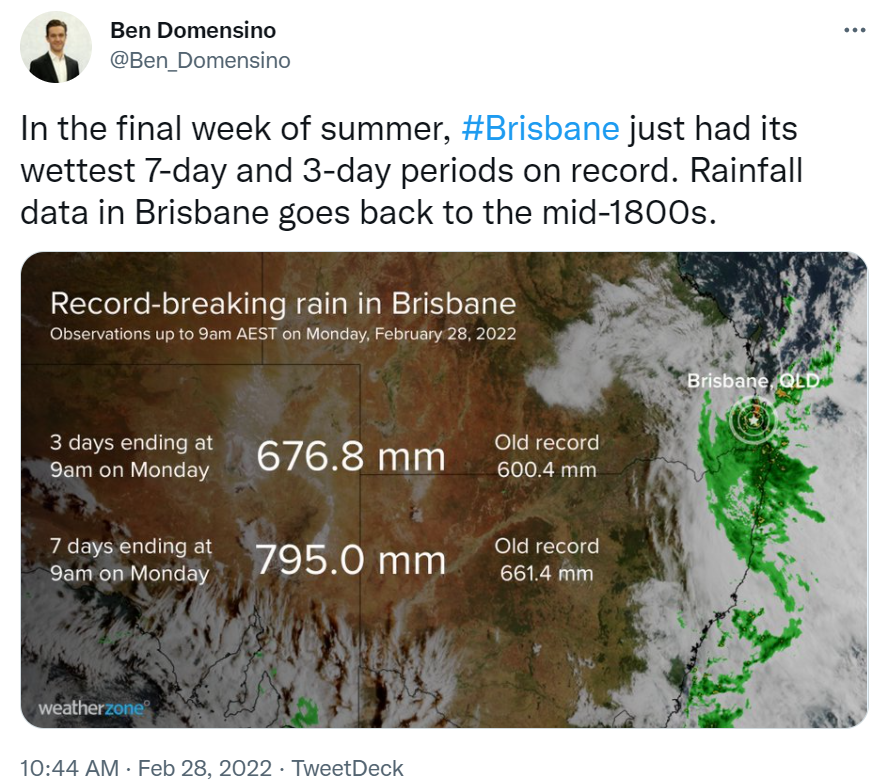
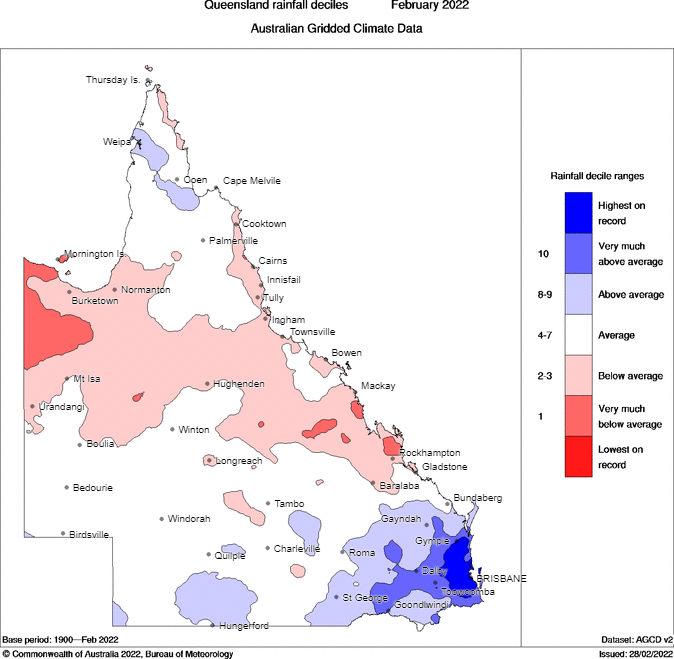
The Bureau of Meteorology’s monthly gridded rainfall analysis map also captures the extent and severity of the event.
From Gympie to the Gold Coast rainfall for the month was reaching the highest on record, and pretty much all of it fell in 3 days! In the image below dark blue denotes “highest on record”.
With the flooding power outages were common and widespread. At the time of writing, Friday the 4th, many locations are still without power. The outage map from Energex (electricity distributor) shows the recent status of outages:

The question arose: how much electricity demand has been knocked out with the floods and resulting network outages?
At the state-level, Queensland daily maximum demand didn’t appear to decline.
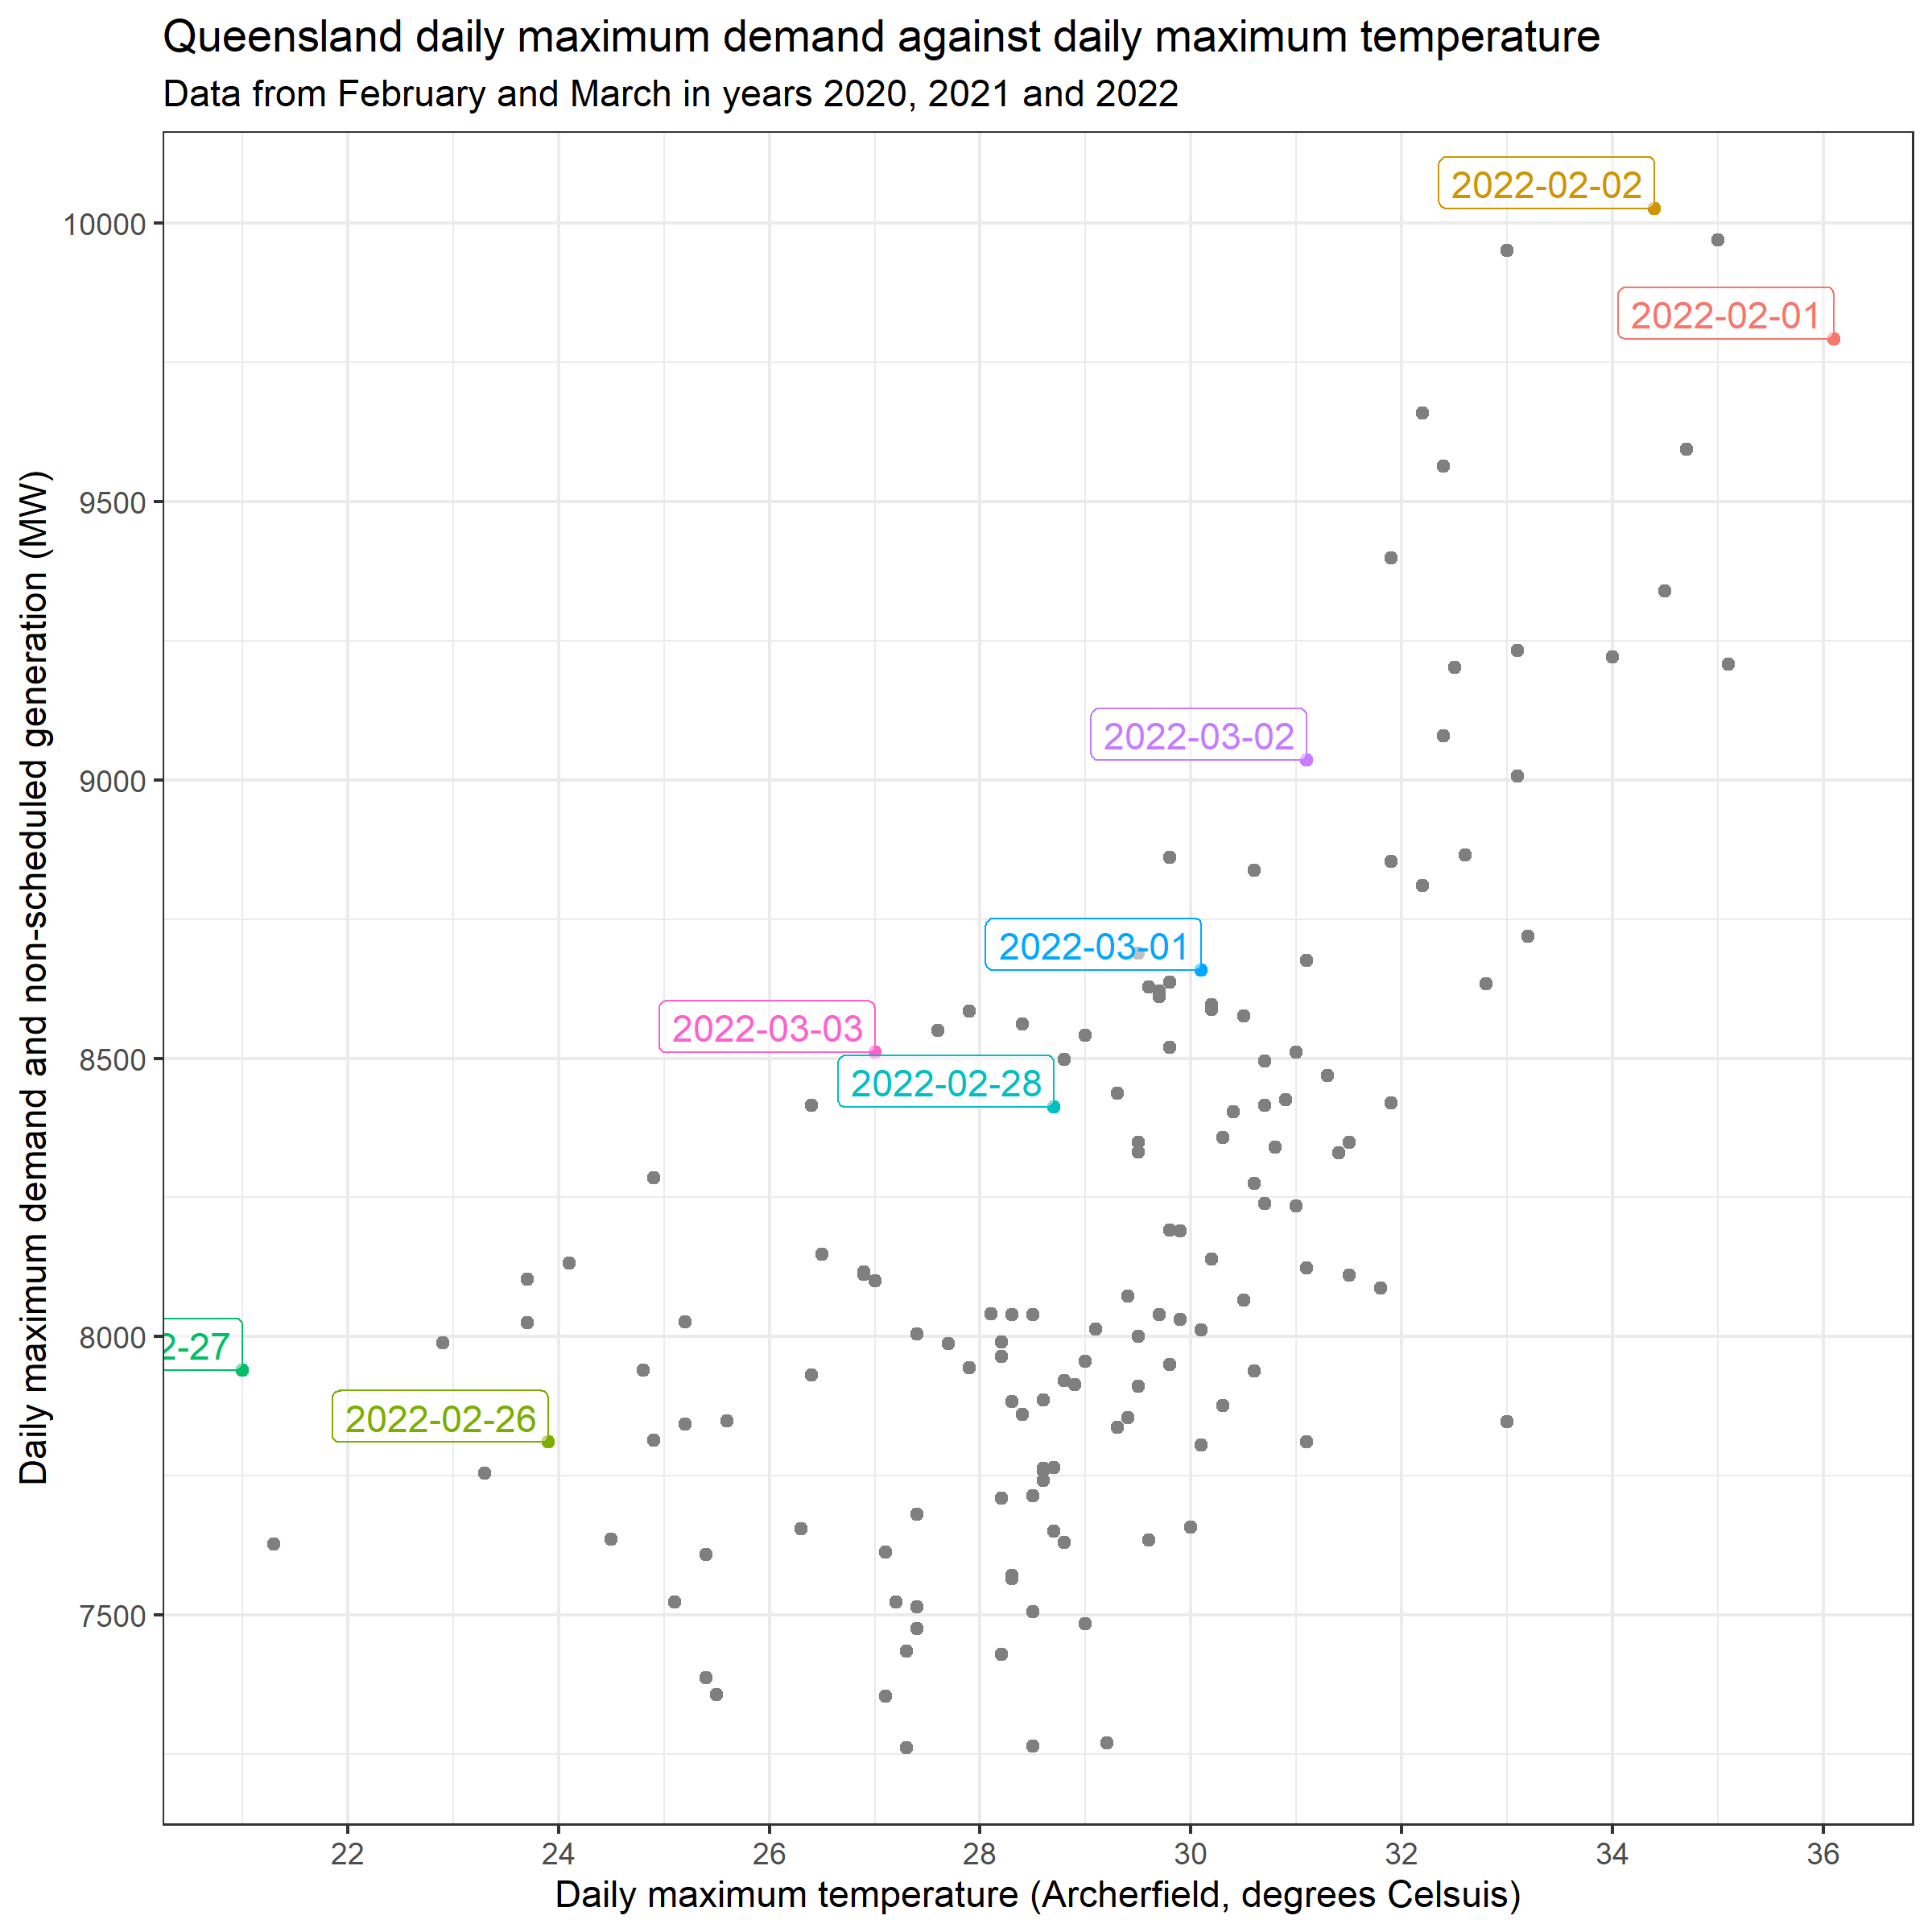
The following chart shows the positive association between daily maximum QLD demand and daily maximum temperature at Archerfield, Brisbane.
We can se the two high -demand days from the beginning of February in the top right.
We can also see the flood-aftermath days: Monday 28th February and Tuesday 1st , Wednesday 2nd and Thursday 3rd March). These four days of interest suggest:
- QLD maximum daily demand throughout the week (28th to 3rd) was not low, relative to other days with similar temperatures from recent history.
- Thursday the 3rd stands out as having an anomalously high peak demand, for the maximum temperature on the day.
Yet we have focused on daily peak demand so far. Perhaps demand at other times of the day was low?
The following chart plots the daily profiles of demand, with the same data used for the chart above. We filtered the data to make it as representative as possible to this week’s temperatures – only weekdays, and only days where the temperature was between 26.5 and 31.5 degrees Celsius, February and March data from 2020 – 2022.
Looking first at overnight minimums, we can see a steady increase in 4am demand as the week progressed from Monday to Thursday. Demand at this time provides a good benchmark of ‘usually on’ equipment that isn’t closely associated to temperature and sunshine levels. The demand at 4am is following an increasing trend, suggesting network outage repairs are being completed and more sites are being reconnected to the grid.
Yet peak demand around 19:00 (7pm), is high on all four days – perhaps unusually high when viewed against the grey profiles of similar days for this time of year.
The largest swing in daytime demand is evident on Thursday the 3rd, between 11:50 to 13:05. This is a decrease in demand of 1,705 MW.
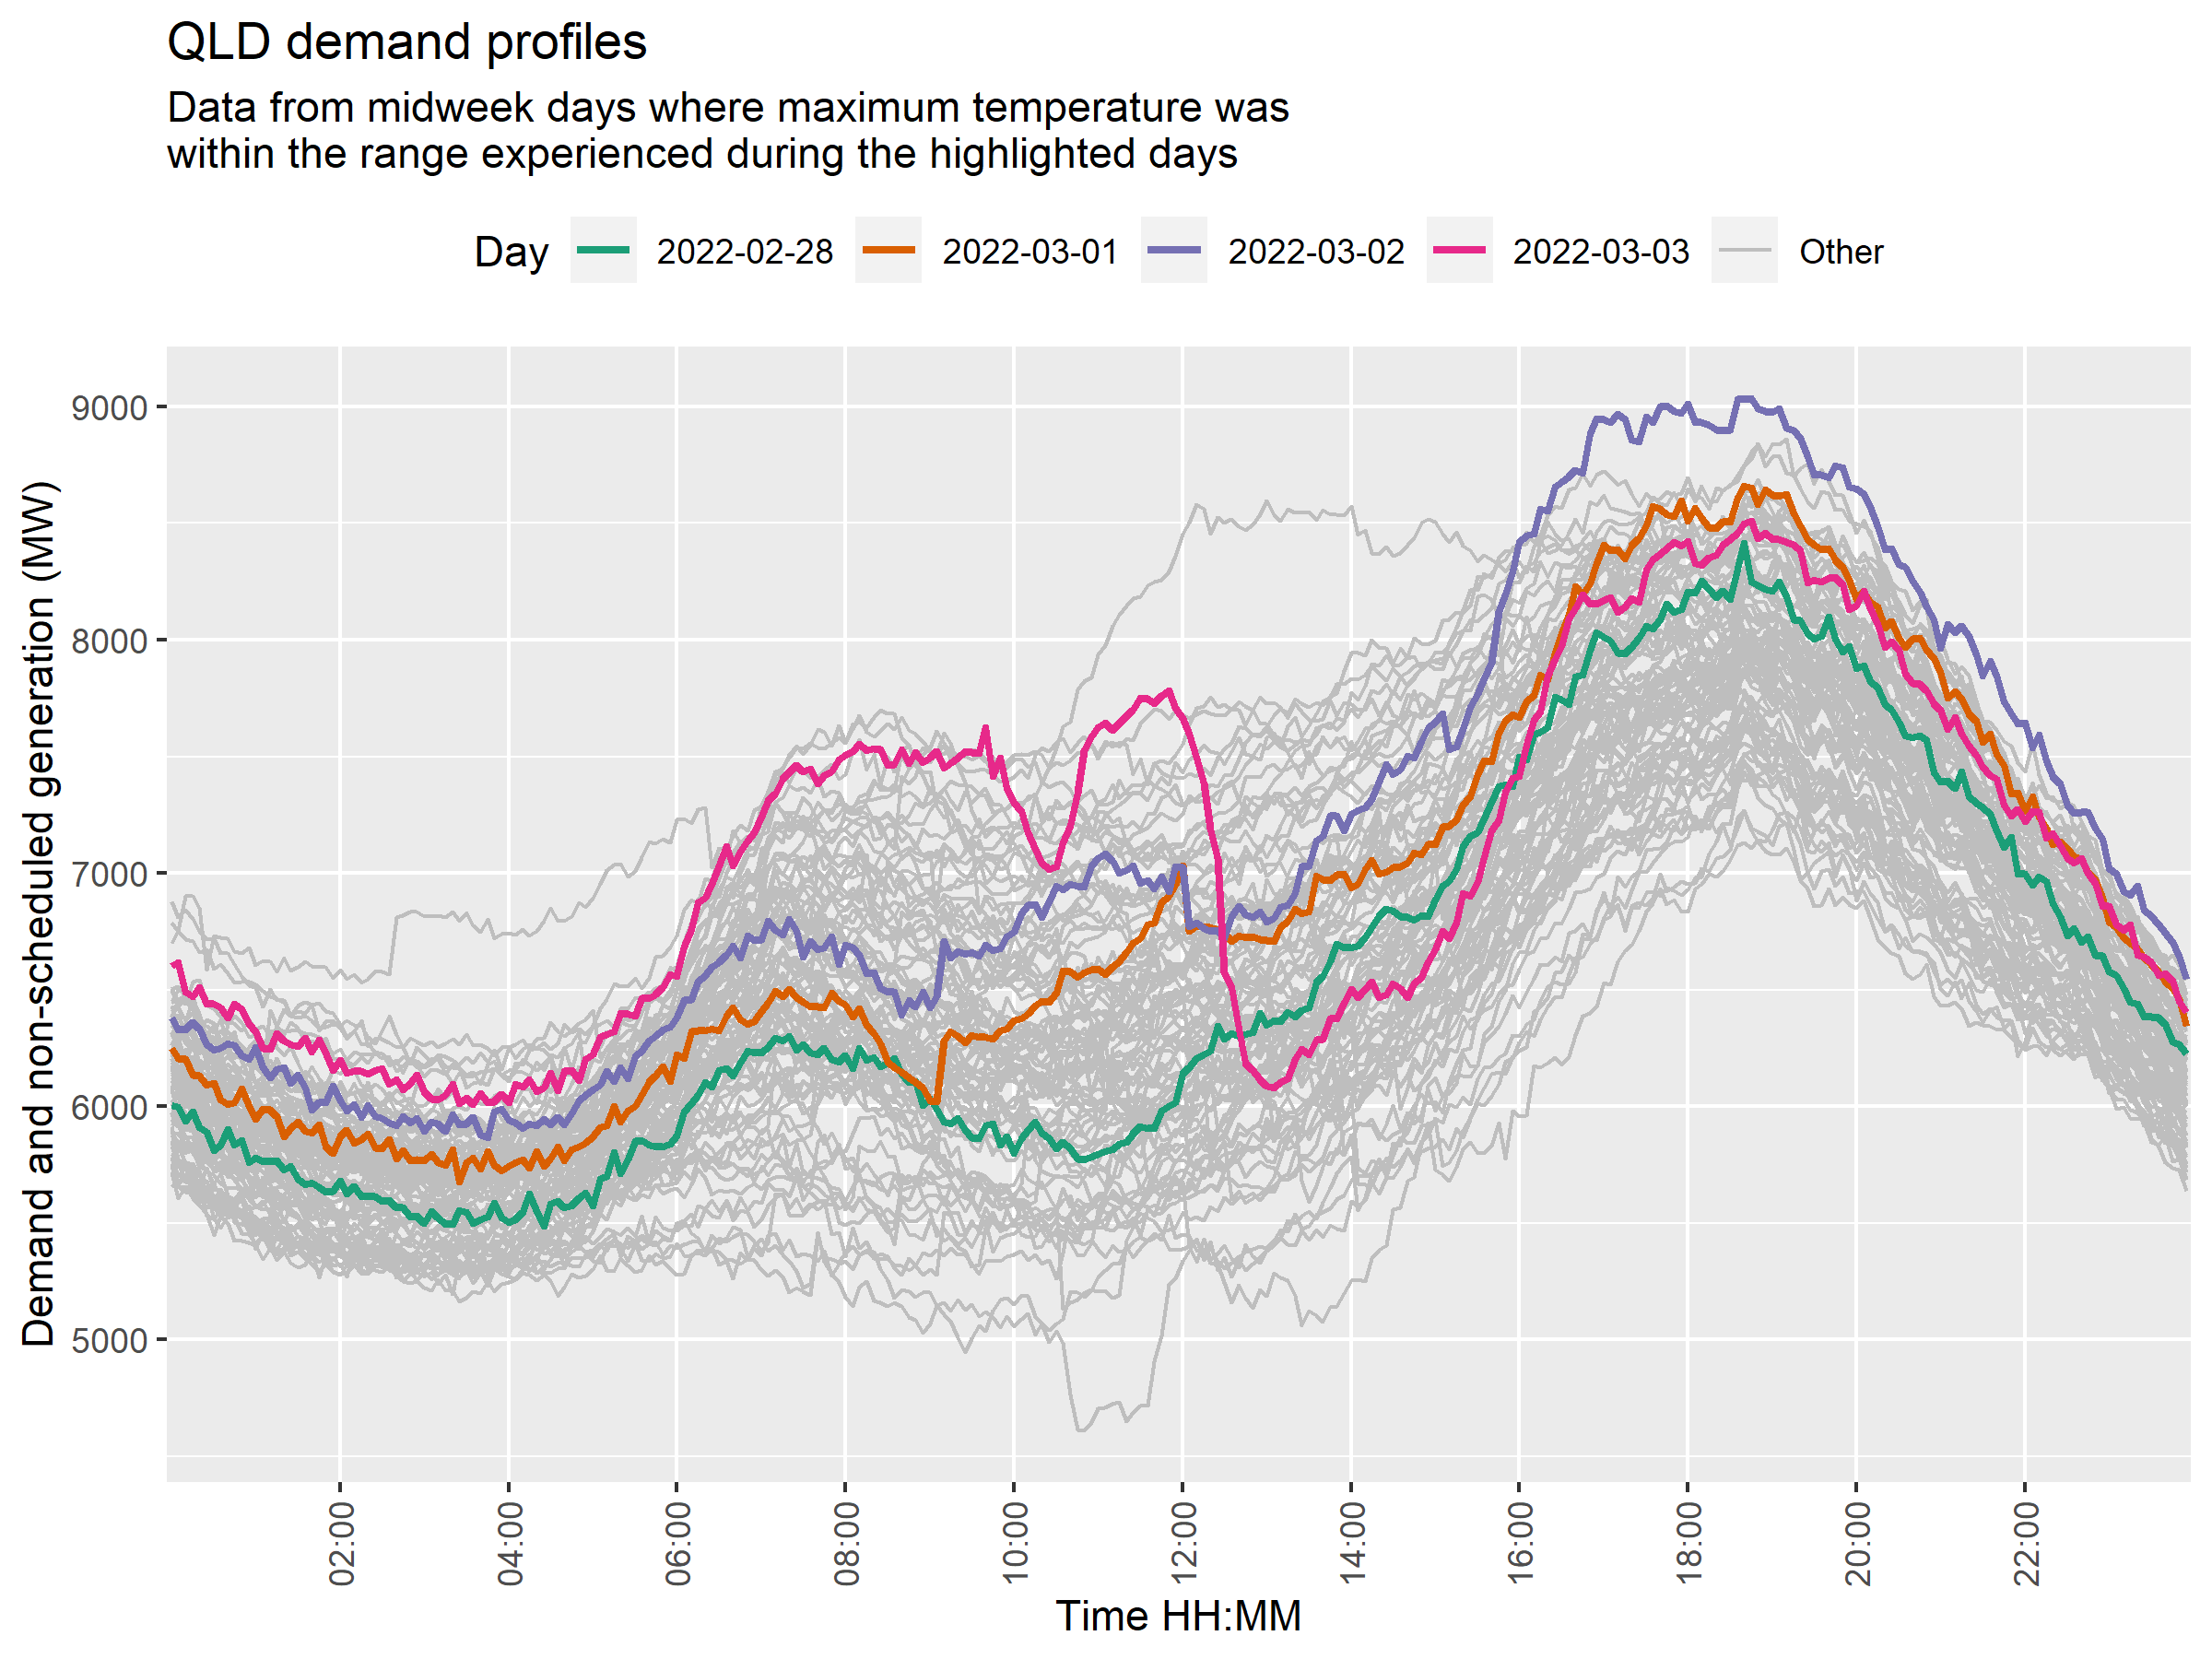
Other noteworthy features of the chart include:
- Pumping load at Wivenhoe showing up as an increase then decrease, 09:00 to 12:00 on the 1st and 2nd.
- Pumping load also occurred at Wivenhoe on the 3rd , however the timing was between 09:45 and 12:15.
Perhaps the impacts were visible at the sub-regional level?
The electricity outages were extensive. To look further for impacts we inspected southeast Queensland zonal demand using Powerlink data.
The Queensland zones of most relevance for flood impacts were the:
- Gold Coast zone which includes Cades County, Southport, Surfer’s Paradise, Robina, Varsity Lakes, Burleigh Heads, and,
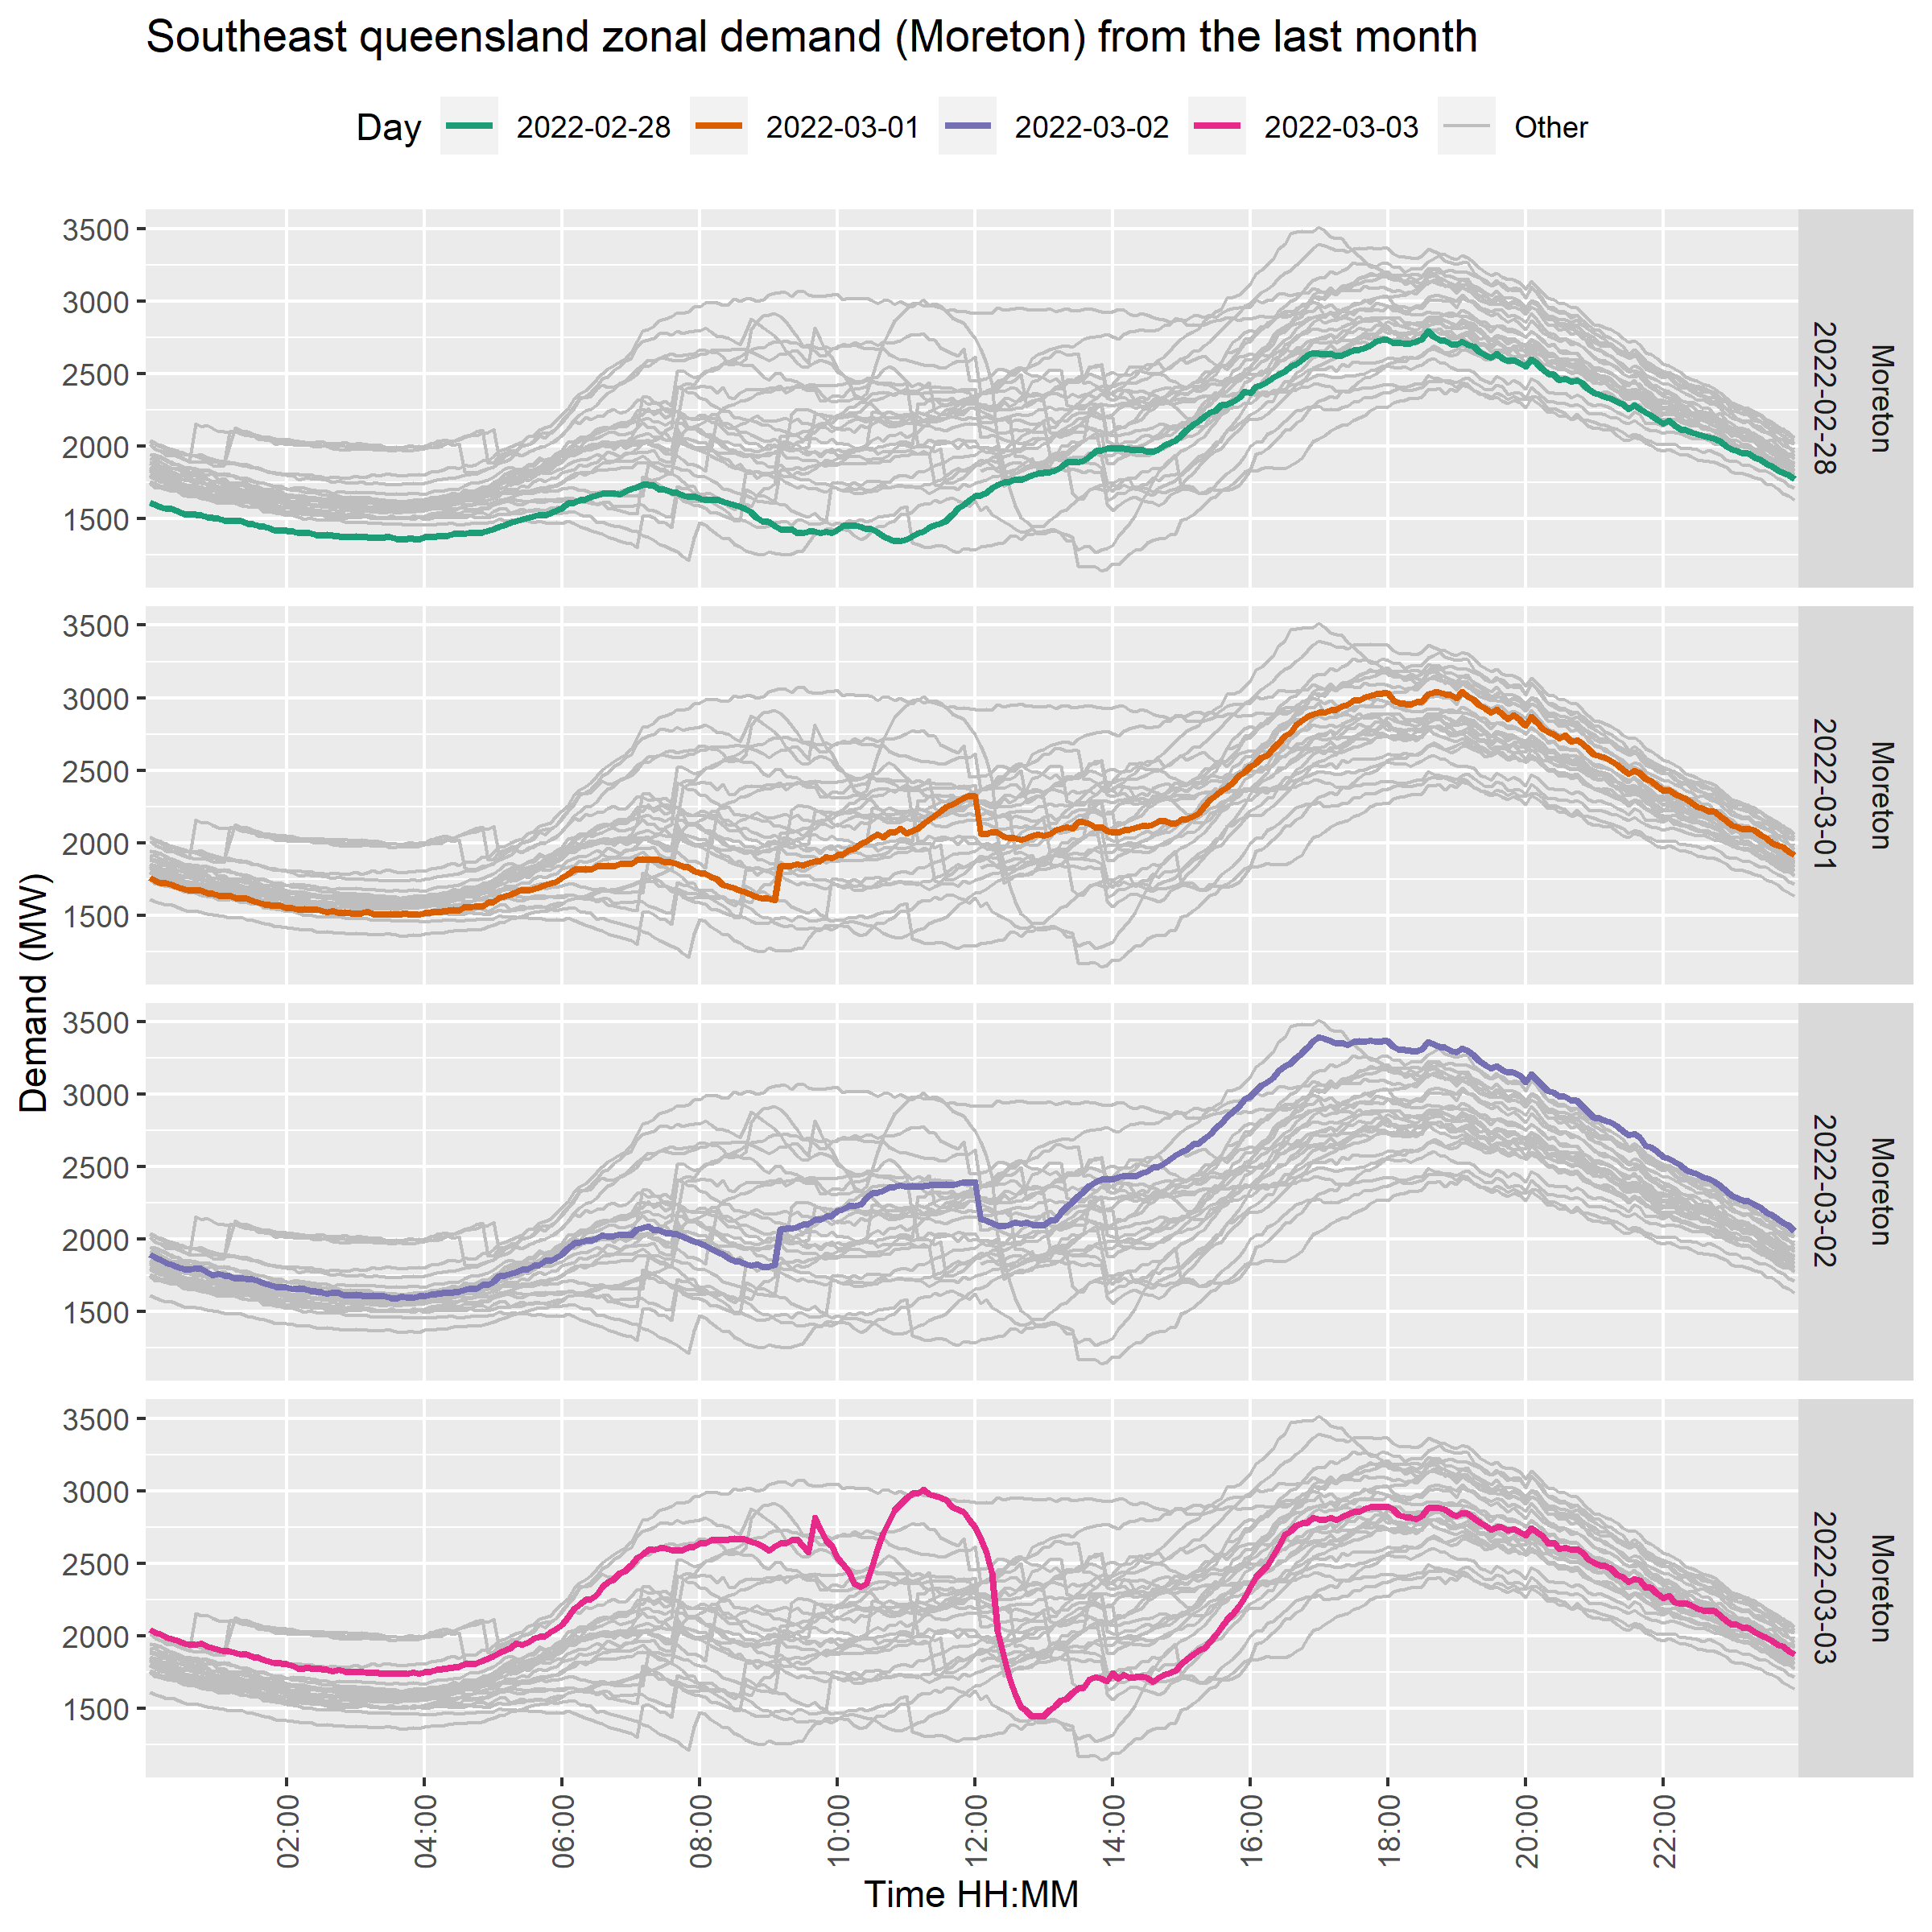
- Moreton Zone which supplies significant load centres in southeast Queensland, including the Sunshine Coast, greater Brisbane, Ipswich and northern Gold Coast regions.
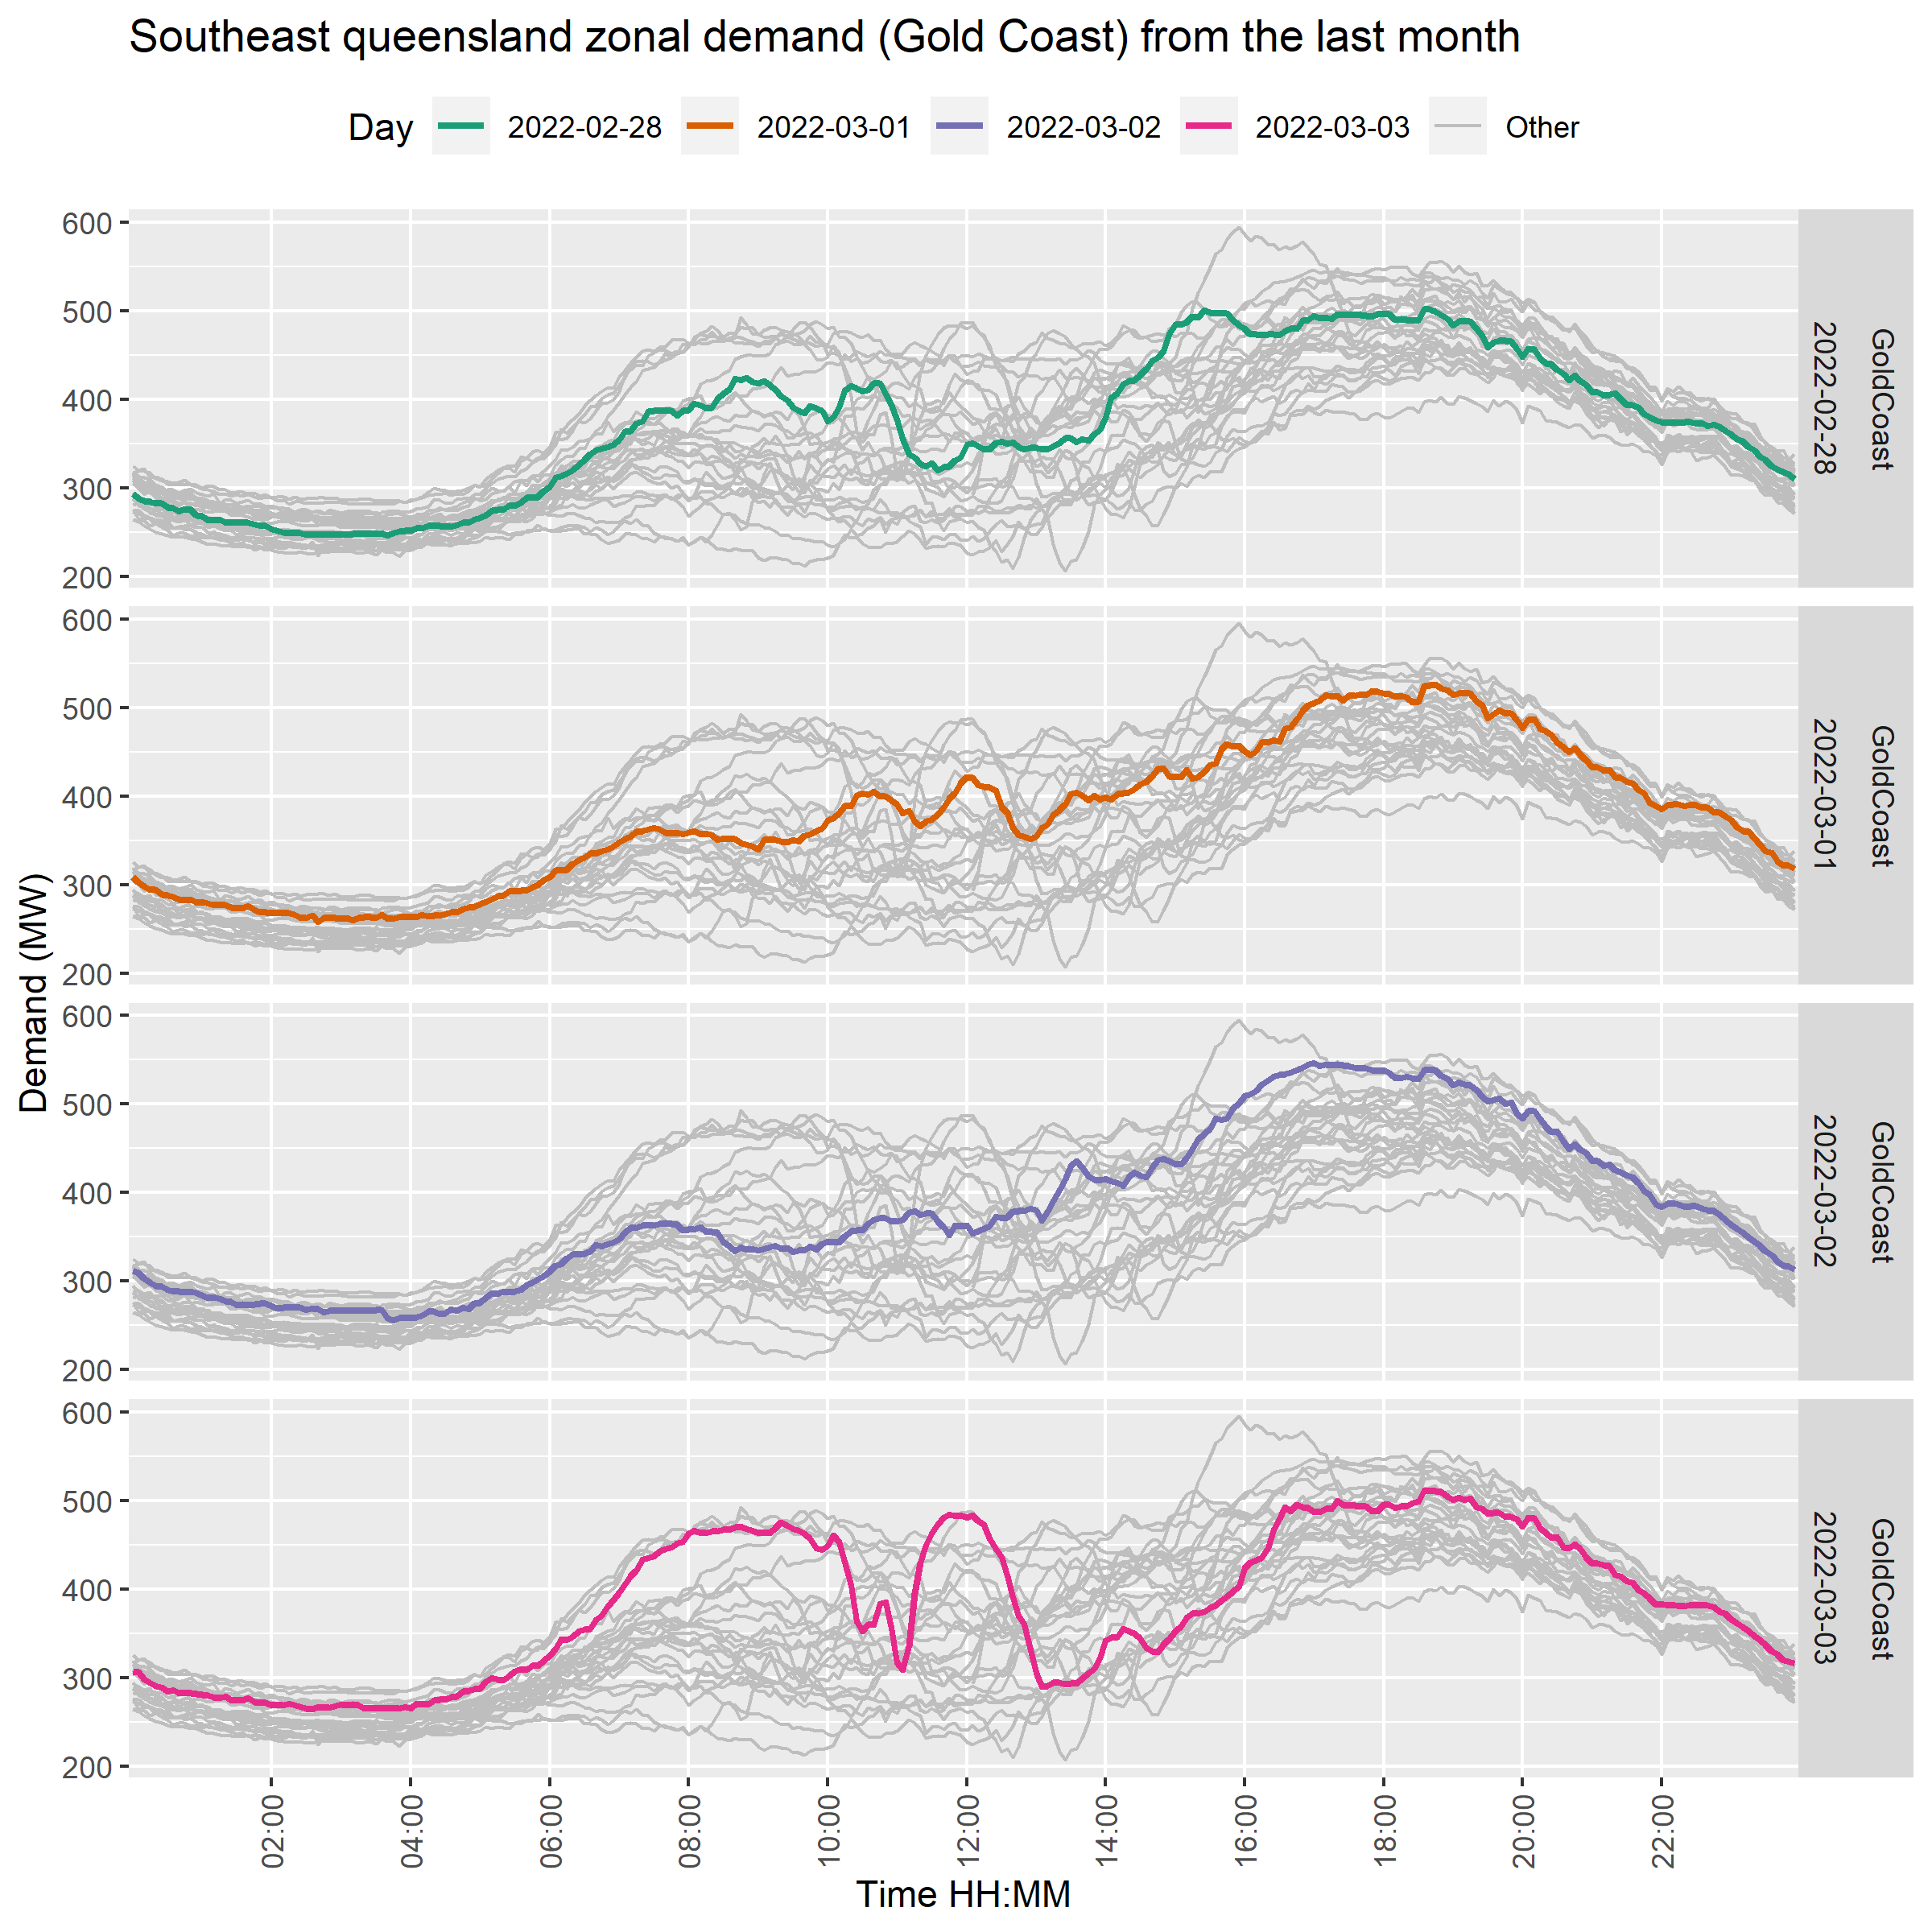
In the charts below we highlight each day against the zone’s demand levels of the recent month (back to the 4th February 2022).
Gold Coast Zone
On the 28th: Demand in the Gold Coast region dropped about 80 MW (20%) around 11:00. It appeared to recover in the hour from 14:00 onwards. By the evening, however, the typical evening peak around 18:00 was absent with an atypically flat demand profile.
On the 1st: Demand levels were steadier than the previous day. There were fluctuations around midday.
On the 2nd: Demand levels were similar to the previous day. The evening peak was more pronounced at 17:00.
On the 3rd: Demand levels rose in the morning from 07:00 to drive a morning peak. Demand dropped just after 10:00 and then recovered again an hour later to produce a midday peak. However, by 12:15 demand began to decline again to 13:00. We haven’t yet assessed whether clouds and rooftop PV may have contributed to this. The evening peak demand level was largely steady between 16:30 and 20:00.
Moreton Zone
On the 28th: Demand in the Moreton region was relatively low. At an estimate, 04:00 demand was 1371 MW. This represents a 14% reduction from median demand at this time (1596 MW). Midday demand was also low having declined gradually from a weak mid-morning peak. Afternoon demand increased but did not exceed median demand levels.
On the 1st: Wivenhoe pumping load is evident in the morning, 09:00 to midday. Demand levels in the afternoon appear to be higher than the median levels for the month. For example, at 18:00 demand was 3032 MW, 5% higher than the median for the month.
On the 2nd: Wivenhoe pumping load is again evident. Demand levels appear to be somewhat regular in the morning and then begin to exceed typical levels into the afternoon. The peak of 3394 MW occurred at 17:00 and was 22% higher than the median for the month. Evening demand stayed relatively high into the next day.
On the 3rd: High demand levels from the previous day continued into the morning. 04:00 demand was 9% higher than median. Large fluctuations occurred after 09:00 and Wivenhoe pumping load (as mentioned when discussing QLD demand above) may have contributed to the downward swing between 12:00 and 13:00. The decline between 12:00 and 13:00 constituted a 1,300 MW decrease. Reasons for this are yet to be fully explored!
Is a conclusion possible?
In trying to uncover whether demand was reduced due to the flooding and network outages in the week Monday 28th February to Thursday 3rd March, we can summarise as follows:
- Peak daily demand levels were higher than typical levels at the state-level.
- Overnight demand levels were low on Monday but by Thursday, appeared to have recovered, and even exceeded typical levels.
- Significant fluctuations in southeast Queensland demand on Thursday 3rd occurred. Reasons for this are yet be uncovered.
Can our readers help us understand? Are clean-up activities driving higher demand, and if so which activities are most significant? Was the severe weather on Thursday to blame for the demand fluctuations seen around midday? Please leave us a message if you have insight to share!
Thanks for the analysis Linton. I too have been wondering about the high consumption considering flooding impacted thousands of residential and business customers in the Southeast. I put it down to the Queensland demand was high as the rest of Queensland is suffering from heatwave conditions – one Cairns businessman described it as the worst summer for heat and humidity since 2006 and Cyclone Larry. The other is there are about 2.1 million residential customers in Queensland of which about 1.5 million are in the Southeast. Similarly, there are about 230,000 small businesses in Queensland and about 140,000 in the Southeast. Energex has done an amazing job getting power reconnected so not sure the amount without power was too high and anyone with power would have been using it for cleaning and air-conditioning as it was hot in the Southeast too. You would definitely need a good nights sleep after a day of cleaning and getting businesses back working so air-con would be a must. Also the rest of Queensland actually consumes more electricity than the Southeast due to mining and heavy industry and this was unaffected by the floods.