Yesterday (Tue 5th May) I posted the lengthy article ‘Balancing Supply and Demand …. in the fast approaching ‘NEM 2.0’ world’. That article began consideration of some aspects of performance that, I believe, need to be considered in detail to make ‘NEM 2.0’ deliver on the energy transition that is gathering page.
(A) Context…
This article is the second (in a group of four Case Studies) that follows on from those thoughts.
These 4 are intended to look at each extreme of a 2 x 2 Matrix defined in the longer article – relating to the concept of aggregated ‘Raw Off-Target’ for both ‘all Coal’ units and also ‘all Wind’ units operational through 2019 – using data compiled for the Generator Statistical Digest 2019.
(A1) … about aggregate Raw Off-Target
In highlighting the ‘worst’ four dispatch intervals through all 105,120 in 2019 for both the ‘all Coal’ and ‘all Wind’ groupings in Tuesday’s lengthy article, I published a summary table – which is copied in here:
| . | Aggregating All SS Wind 39 units |
Aggregating All Coal 48 units |
| Under-Performance (including trips) Aggregate Raw Off-Target >> 0MW |
The worst dispatch interval for wind was 02:25 on 1st September 2019. On this occasion, the ‘all wind’ group saw an aggregate Raw Off-Target was +375MW. Several other things that could be noted: This will be discussed in a Case Study here. |
The worst dispatch interval for coal was 08:05 on 9th October 2019. On this instance, the ‘all coal’ group saw an aggregate Raw Off-Target as high as +709MW: This was discussed yesterday in this Case Study here. |
| Over-Performance Raw Off-Target << 0MW |
The worst dispatch interval for wind (-301MW) was 19:25 on 31st October 2019. In this instance: This will be discussed in a Case Study here. |
The worst dispatch interval for coal was 15:05 on 12th October 2019. This was just 3 days after the worst outcome at the opposite extreme! This is the subject of this particular Case Study. |
This article today is the second of four case studies.
(A1) … about why we invest time in these Case Studies
Also worth reiterating some of the reasons why we significant invest time in delving into specific instances through case studies like these (some of which make their way onto WattClarity).
Do you know of others who can help us expand our capability?
(B) A focused look at this Dispatch Interval
In this particular Case Study, we focus on the ‘worst’ example of an aggregate Raw Off-Target for ‘all coal’ units well below 0MW (i.e. where these units were, collectively, over-performing) – specifically this occurred at 15:05 on Saturday 12th October 2019.
(B1) All Coal Units
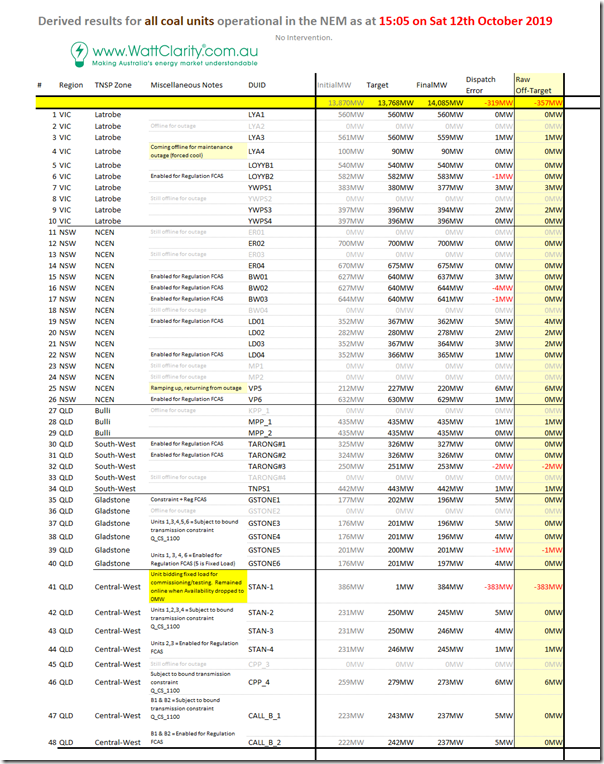
In the table below I have compiled the relevant data for all of the 48 x coal-fired units at that dispatch interval (with those offline on outage indicated):
Click on the image for a larger view.
(B2) Stanwell Unit 1
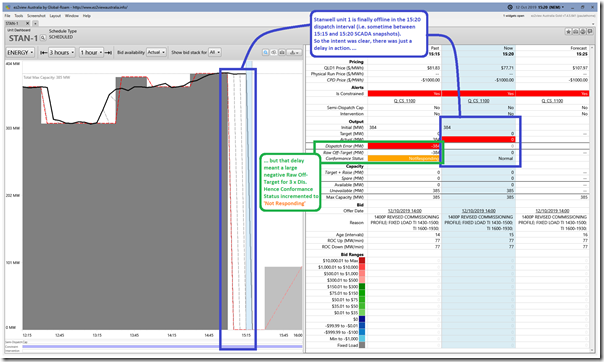
In the table above, we can clearly see that it is a single unit (Stanwell unit 1) that provides the major contribution to the extreme negative Raw Off-Target (which, at –357MW, is the largest collective over-performance seen for ‘all Coal’ throughout the year).
Whilst it is generally understandable how coal units – or indeed any unit – can underperform (such as Kogan tripping three days before this) it’s probably less well understood that situations like this could arise, where units over-perform (and by such a large amount). Hence I was curious to drill in via ‘Time-Travel’ in ez2view to explore more.
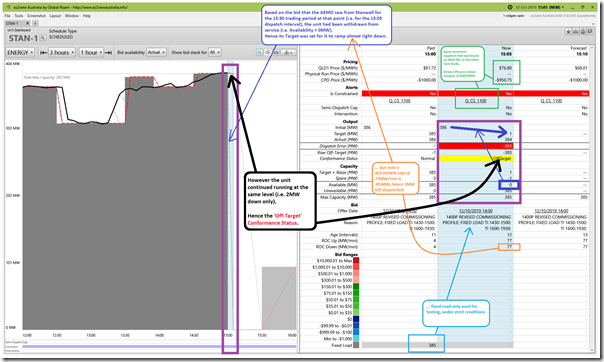
Here’s the Stanwell Unit 1 in the ‘Unit Dashboard’ widget with quite a few annotations, as there’s a bit going on in this dispatch interval:
Click on the image for a larger view.
Important to note that the generator was using ‘Fixed Load’ bids, which are used only under strict test conditions by a generator. The AEMO sees these (in NEMDE) and dispatches them before bids at –$1,000/MWh (i.e. cheaper). Hence the very strict conditions under which such bids can be used.
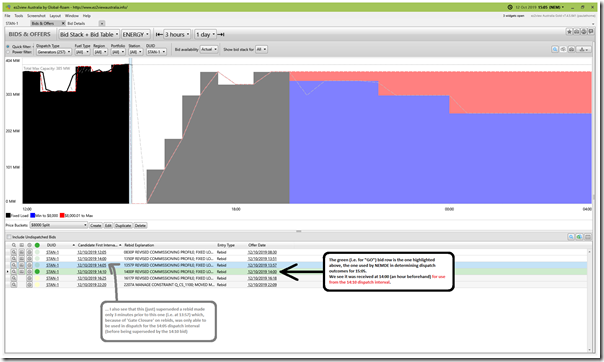
I was curious to see why Stanwell might (apparently) withdraw the unit from service in this dispatch interval, but then look to ramp back up from 15:30 (i.e. looks like a ‘trip to house load’ test, which Stanwell has done before for SRAS validation) and yet keep running when the AEMO dispatch target thought it was turning off. Hence I ventured to the ‘Bids & Offers’ widget to see more of the sequence of events:
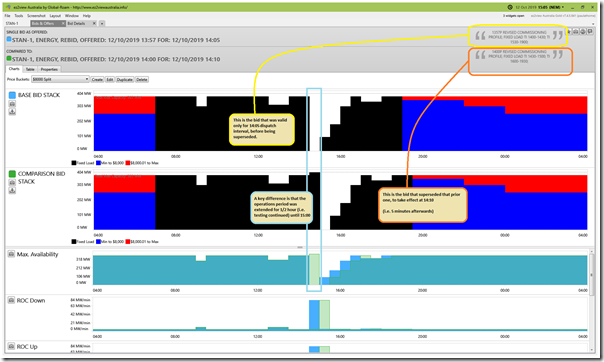
So we see that the bid used for dispatch at 15:05 (i.e. the dispatch interval in question) had only taken effect for the 14:10 dispatch interval, an hour before. This had superseded a bid made immediately before that which was live just for the 14:05 dispatch interval. Using the ‘Compare Bids’ function in ‘Bids & Offers’ we can produce this comparison of the two bids:
So my guess, in seeing the above, is that the testing regime that was being followed for Stanwell unit 1 on the day was changing a little as the day progressed. For some reason (the specifics are not known) the operational period continued briefly beyond the ‘should have been offline’ point in the 15:05 dispatch interval.
We can see in the following image of ‘Unit Dashboard’ widget for the 15:20 dispatch interval that the unit was offline in by 15:20 (i.e. 15 minutes after AEMO thought it would be):
Note that the title bar of ez2view is a different colour when Time-Travelled to a different dispatch interval.
1) As per the annotation, the delay of 3 dispatch intervals (and significant negative Raw Off-Target in each because of over-performance) meant that the ‘Conformance Status’ had incremented to be derived as ‘Not Responding’ for 15:20 (i.e. a step closer to ‘Not Conforming’).
2) What this means, in the context of the ‘worst’ dispatch intervals for aggregate Raw Off-Target for coal through 2019, was that the subsequent two dispatch intervals were also quite low:
(a) we know that 15:05 was -357MW (the lowest in the year, as noted in this article);
(b) at 15:10, the result was -218MW (clearly there must have been some offset elsewhere, but I have not had time to look)
(c) At 15:15, the result was -335MW (so not quite as bad as the ‘worst’ case)
(d) By 15:20, with Stanwell unit 1 offline (as per Target), this deviation had dropped to only +13MW.
(B3) Other coal units
In the table above we can also see that the contributions to aggregate Raw Off-Target are quite small, and mostly at 0MW or above. Only two other units are (slightly) negative.
Out of general interest I have flagged two others to briefly look at here.
(B3a) Loy Yang A4
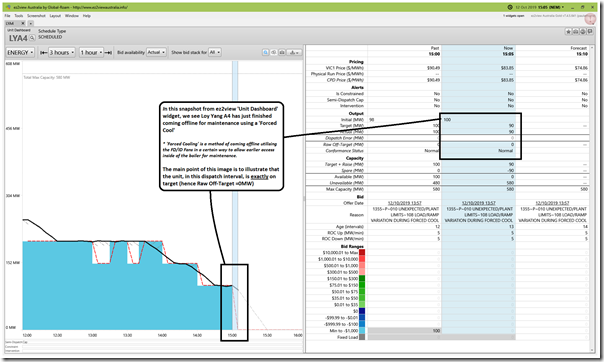
In the table above we see I’d made a note that Loy Yang A4 came offline in this dispatch interval, and used ‘Forced Cooling’ in doing so. Here’s a picture:
As noted on the image, the main point (in terms of the context of this article) was that the Raw Off-Target for this unit was 0MW.
(B3a) Vales Point 5
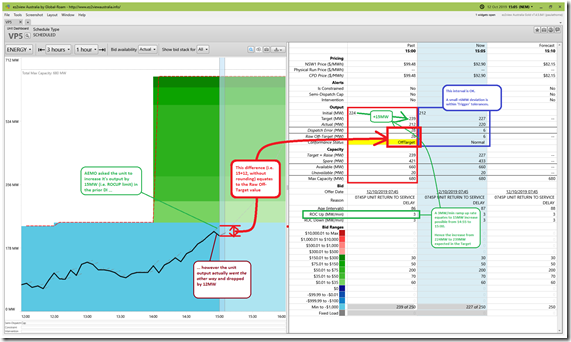
Now, some readers might remember that we calculated Vales Point unit 5 to be the ‘worst’ individual performer of all the coal units through calendar 2019 – something we will delve further into later, as a separate article. For now, here’s a snapshot of VP5 at the same dispatch interval:
On this instance we see that the unit was slightly positive (i.e. +6MW) for the 15:05 dispatch interval. Hence no note of alarm in the tabular summary above (though we did note that the unit was returning back to service, and we understand that it’s typically more difficult for a unit to meet its target when it is cycling, compared to just ‘steady state’ operations).
As it happens, the 15:00 dispatch interval (shown in the table immediately beforehand) shows VP5 having been derived as having a ‘Conformance Status’ of ‘Off-Target’ (i.e. Raw Off-Target = +28MW) because its output ramped down by 12MW instead of up by 15MW (i.e. 5 x its ROCUP rate of 3MW/min). Readers should take this as an illustration of the greater difficulty a unit when ramping up, or ramping down.
————-
…and that’s all I have time for in this Case Study (two down, two more to go – with the next two being about the ‘all wind’ aggregation).


Good morning Paul
I am a retired operator from Gladstone P.S.
On line forced cooling has nothing to do with FD/ID fans, it is all to do with boiler pressure and steam saturation temperatures.
Fans are used after the boiler is offline and drained.
Regards
Darryl
Thanks for the clarification, Darryl!