Yesterday (Thursday 7th Nov) over on RenewEconomy, Giles Parkinson published this article about Tailem Bend Solar Farm in South Australia noting “This solar farm has to switch off every second day due to negative prices”. In doing this, Giles asked for a couple illustrations of operations of the solar farm over recent weeks, which we providing using our NEMreview v7 online software application.
(A) About “Energy Foregone” – and (possibly) “Spot Revenue Foregone”
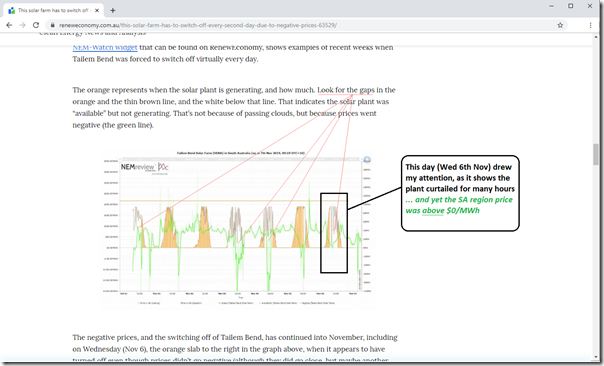
As noted to Giles, and reflected in his article, as a approximation one can look at the gap between the (ASEFS-deemed) Availability of the unit and its Output to gain a sense of “Energy Foregone”. In the week shown in the chart copied in from Giles article here, there is a fair bit of “white space” – hence a significant volume of “Energy Foregone” that might be a surprise to some readers – this seemed to be the main thrust of Giles’ article:
For our clients having accessed to licensed versions of our software you can access your copy of this same trend here for NEMreview users, and here for ez2view users. Just change the date range at the top of the chart to have a look at different periods.
Readers should understand that there are several different reasons why any plant (including Tailem Bend Solar Farm (DUID = TBSF1)) might be available and yet not produce output – or produce lower output than availability. Two big ones are:
Reason 1 = being constrained down (i.e. as a result of constraint equations); and
Reason 2 = being dispatched down (i.e. as a result of how the unit has bid, and the outcomes of the NEMDE dispatch run).
It’s important that readers understand the difference – discussed further below.
However the main point I wanted to flag that drew my attention was what happened, in particular, on Wednesday 6th November (two days ago now) – where it appears that the Solar Farm not only saw a significant volume of Energy Foregone, but also a non-trivial volume of “Spot Revenue Foregone” because the trading price for the day never actually dropped below $0/MWh:
1) The lowest it reached was $1.44/MWh in the 12:00 trading period
2) In Giles article, he notes that the Solar Farm has a clause in the contract that requires the plant not to operate when prices are negative:
Tailem Bend has an off-take agreement with Snowy Hydro that broadly requires it to switch off when wholesale electricity prices go into negative territory, although the details are likely to be more complex than that.
3) In our experience this type of arrangement is pretty common amongst more recent PPAs struck between retailers and new entrant generators – though we do have to remind ourselves that we don’t know the specifics of this particular arrangement with Tailem Bend Solar Farm.
My quick calculation with the AEMO data from that day shows that the spot revenue foregone just for that day might have been a little over $10,000.
There are a number of simplifying assumptions made here – including that:
1) the trading prices in at least some of these dispatch interval would have been different (most likely lower) had the “foregone” energy been included in the dispatch process; plus
2) these kind of retrospective “could have made better decisions” processes commonly ignore the impact of risk and uncertainty in making decisions in real time in a NEM environment that can, at times, be stressful.
Hence the number should be used as a guide (only) to the order of magnitude. Not sure about other readers, but missing out on $10,000 in a day might hurt a bit?
(B) Animation of 10 hours on Wed 6th November
Given that we have other reasons to invest time in putting Case Studies like these together, I was happy to invest a few hours to put this article together today to give some of our readers (including a growing number of new entrant generators who might be operating facilities similar to TBSF currently or in the near future) as some weekend reading.
We’re getting quicker at these as well – though, as always, please note that there may well be mistakes in what follows because of the rush (and more generally just because I’m not perfect).
(B1) Why we’re preparing (and sometimes publishing) these Case Studies
We’ve posted two of these case studies recently (RRSF1 on 10th Oct 2019 and DAYDSF1 on 3rd Sept 2019) and are likely to produce a number more of these in the coming weeks and months, some of which we might also share on WattClarity. These are the two primary reasons why we’re creating, and then posting, these Case Studies:
| Audience #1 Users of our ez2view software application – who seek to use the software to produce their own insights | Audience #2 WattClarity Readers – who appreciate the insights freely shared on this information site |
| Our prime focus is* our growing group of licensees to our ez2view software (the higher-end dashboard we provide to a growing number of Scheduled or Semi-Scheduled Generators operating in the market – amongst others).
* when I say “is” what I really mean is “must be” as these clients are the means by which we have the wherewithal to share some insights more broadly on WattClarity. It’s software that’s unashamedly focused on the physical market – focused on providing answers to questions like ‘why did that happen?’ We’ve invested $MIllions in R&D for ez2view in prior years, and investment path that will continue into the future as the level of complexity facing wholesale market participants continues to grow. As an outcome of the rapid/iterative development principles we’re operating under, we are producing several new ‘Bleeding Edge’ versions of the ez2view software every week. Part of this rapid development process is that we observe, tag, and then later analyse “interesting” events in the NEM through process such as Case Studies like these. These Case Studies help us to explore the degree to which our software (and specifically in this Case Study, one particular Widget amongst the 1,000s available – the “Unit Dashboard Widget” – helps to make levels of complexity clearer, and understandable. |
As the energy transition continues to progress, we see a growing number of new entrants begin operations as generators in the NEM, or (further upstream) investigate possibilities to develop their own generation.
A number of these new entrants are coming onboard as clients (e.g. to use our ez2view software when operational, or more generally with our Generator Report Card 2018 and other products, and we’re intrigued by the prospects of other new ventures we’re involved with). However that is only a subset of the rapidly expanding number of organisations and individuals who are taking an increasingly close look at the National Electricity Market – with a broader group of people subscribing for update from WattClarity on days where new articles are published here. Given that we’re investing considerable effort (including input from some on our Customer Advisory Board) to create these case studies as a way of exploring specific nuances in the NEM we want our software to provide clarity about (which will flow through to benefit our growing group of software licensees), we reasoned that we may as well publish some (but not all!) of these, in order to provide value to the WattClarity readership (a broader group of stakeholders). There can be an added benefit to us in publishing these Case Studies – hence we ask our readers to help us understand the extent to which this event (and the broader implications of events like this) are clearer as a result of the Case Study? |
With the above two (overlapping, but also distinctive) audiences in mind, let’s start with the substance of the case study… (please do let us know what we have missed, or misunderstood, anything in the comments below or in the animation?)
(B2) Here’s the Animation
We’ll start this animation at 08:00 NEM time on the day, and run through through for ten hours until 18:00 (those not so familiar with the NEM are reminded that all times here are “NEM time” or UTC+10, so not local time in South Australia):
As noted above, we’re very keen to learn what we have missed, or misunderstood, in the above animation (and follow-on discussions below).
(C) Specific Points for Discussion
Pulling some specific dispatch intervals and comments from the animation above, we thought it would be beneficial for some of our readers if we expanded on some points as follows:
(C1) About “switching off when the price is negative”
It’s mentioned a number of times in different media (in prior articles on WattClarity I will have talked about this before). We’re certainly fielding an increasing number of requests from different types of people who would like our assistance with this.
However it is crucial for everyone to keep in mind the following very clear distinction between two very different types of generators*:
* by “generators” we mean supply-side options, which would include storage facilities discharging – and also supply of Negawatts (should they be incorporated into the dispatch process under the rule change discussed here)
| Generator Type #1
Scheduled, and Semi-Scheduled Generators |
Generator Type #2
Non-Scheduled Generators, |
| With these plant the most important thing for readers to understand is that they cannot simply switch off when they don’t like the price they are getting.
[well, actually, we did find this example here where it appears one wind farm did that – and have found other examples as well – but my point is that this is not what should be happening, according to my understanding of the Rules] There’s a good reason for this – in that it would make the AEMO’s job impossible to do (in terms of balancing supply with demand to keep the lights on) if everyone did what they wanted. Instead, generators that are Semi-Scheduled and Scheduled need to try to achieve the outcomes they want via the Bidding and Dispatch Process.
|
Below a certain threshold the rules currently assume a lower level of sophistication amongst smaller generators – and a lower collective impact on balancing supply/demand.
They are, in effect, allowed to “do what they want” by switching off if they don’t like what the price is for the region they are supplying into. This leeway, coupled with the fact that the AEMO also sometimes won’t even have visibility of these generators, does have the potential (when adding up across an increasing number of suppliers who are similarly incentivised) to make the AEMO’s Primary Role of ‘keeping the lights on’ a whole lot more difficult into the future. In our Generator Report Card 2018, we included discussion (Theme 13 in Part 2 – What’s the future for Participation Categories in the NEM?) about the future implications of this leeway (amongst other things). |
The main point, here, is that we all need to be quite clear which category a “generator” (i.e. a supply-side option) fits into, as the way they are treated is very different!
(C2) What’s the price trigger to use?
We extend the table above to think about which price trigger to use – nothing is as simple as it might initially seem in the NEM, as there are multiple price triggers (including the following):
| Generator Type #1
Scheduled, and Semi-Scheduled Generators |
Generator Type #2
Non-Scheduled Generators, |
| Generators in this group need to recognise that there are essentially two main prices that they need to be aware of simultaneously:
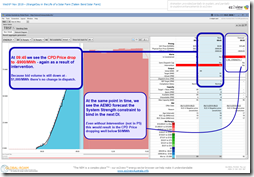
Price Type A = what they will be paid: A1) which includes all of the complications noted for the Non-Scheduled generators in the second column A2) this is coupled with the fact that (because the generators are larger in this type) the implications of producing at times of negative prices can be much more expensive. Price Type B = what they are dispatched on. B1) It’s important to note that this is a different price. B2) In our animations, it is shown as the CPD Price (visible in ez2view), and the way that it is formed is quite complex (and depends on whether there is Intervention, and whether there is Constraint). These differences were very clear in the 09:45 dispatch interval highlighted below, where the dispatch price for 9:45 was $0/MWh but the CPD price was so much lower – and (at the same time) the forecast CPD price for 09:50 was also likely to be so much lower than the dispatch price but for a different reason. Contact us (+61 7 3368 4064 or this form) if you need to know more about this… What complicates this further is that Scheduled and Semi-Scheduled generators are given targets by NEMDE based on bids they must place in advance of dispatch. Hence some added layers of complexity in trying to achieve outcomes that a generator might be happy with. |
Until 1st July 2021 (when 5 Minute Settlement begins) the NEM operates with 5 minute dispatch and 30 minute settlement.
This presents a number of different implications for different parties. For spot-exposed, non-scheduled generators, it adds complexity to their operations even when they can “run when they want”. The main reason for that is that the actual price they will be paid for energy generated in a half-hour will only be known*, in reality, about 26 minutes into a 30-minute trading period: * and even then, on occasions, prices can be revised. For many of our 20 years of operations we have worked with suppliers in this space to help them understand how to lower the risks inherent in this process. In contrast, we’ve seen what appears to be some pretty clumsy attempts to cope with this (in terms of negative prices) with other generators recently, and we’ve heard of others more directly – food for other Case Studies? We already have a number of smaller solar farms (i.e. much smaller than TBSF) as clients where our data feed triggers “turn off” signals for them in their control systems onsite, to curtail production at times of negative prices. Some have been operating for quite a while. Contact us (+61 7 3368 4064 or this form) if you need to know more about this… |
The main point, here, is that there is some considerable complexity involved in interpreting the data published by the AEMO. You need to ensure you’re looking at the right data (as the animation above shows, there can be a large difference between the Correct and the Incorrect Price!)
(C3) Why does TBSF shift their volume all the way up to $14,700/MWh at the RRN?
I can’t actually answer that question – though I could try to have a guess. It certainly does not seem immediately logical if all they were needing to do was avoid dispatch at times when the trading price for the half-hour was going to be below $0/MWh. Maybe there was some other reason that prompted them to do what they did.
Hence I am very keen to hear back from people who can help us explain what some plausible reasons might be…
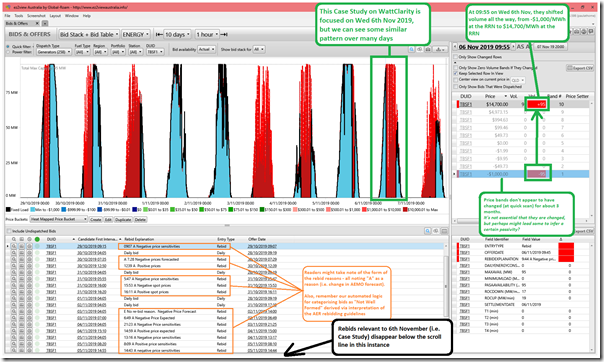
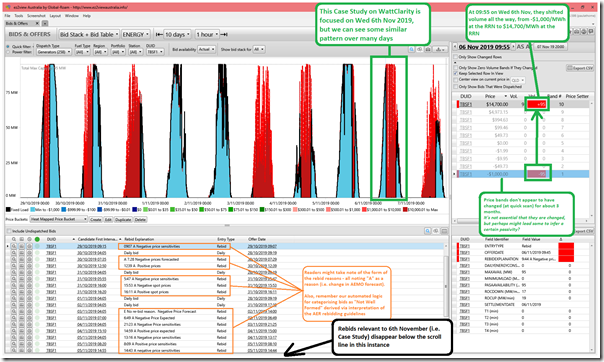
Here’s the view from a different widget in ez2view (the ’Bids & Offers’ widget) focused just on TBSF and showing 10 days of history from 29th October through until the end of the day yesterday (Thursday 7th November):
We note that at 09:55 all the volume offered at the unit was shifted all the way from –$1,000/MWh at the Regional Reference Node all the way up to the current Market Price Cap ($14,700/MWh at the Regional Reference Node).
Furthermore, this pattern seems to have been repeated on 7 of the other 10 days shown in the window. It’s not clear to me why you would be doing this if all you wanted to do was avoid being dispatched a times of negative trading prices…
Remembering that it’s impossible to truly know a participants motivation, that does not stop curious people (like me) from trying to guess – and it does not stop others from lapsing quickly to conspiracy theories (which is something I consciously try to avoid). If anyone can help me understand more, please shout!
(C4) Being Off-Target in the 09:55 dispatch interval
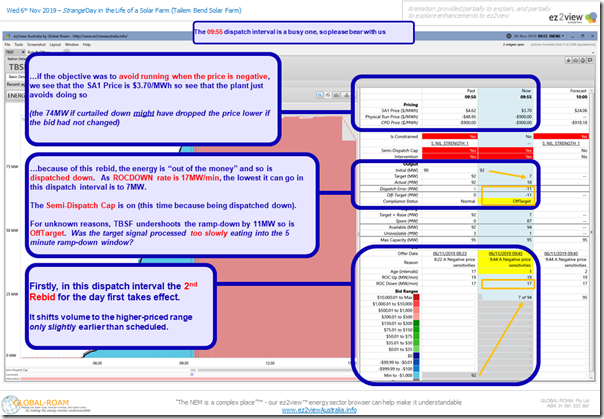
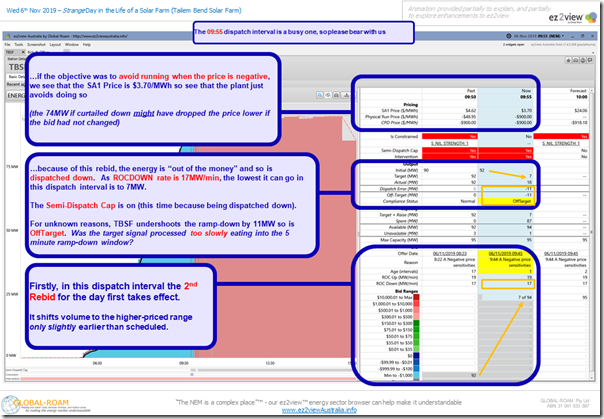
I’ve copied out the snapshot here for the dispatch interval ending 09:55, complete with the annotations used in the animation (click on the image for a large-size view):
AEMO dispatched down the unit because it had priced itself (hugely) out of the market as a result of the 2nd rebid for the day.
As its bid ROC Down rate was 17 MW/min, this equates to a total volume reduction of 85MW – which is why the unit was given a target of 7MW (down from the Initial level of 92MW measured at the start of the dispatch interval). In other words, it could not reduce fully to 0MW despite the fact that the volume was now offered well above the CPD Price.
On top of this, we see that the TBSF short-changed itself in trying to meet the target – only reaching the “Actual” level of 18MW instead of the Target of 7MW. That means a Dispatch Error of –11MW (which also means, because TBSF is not enabled for Regulation FCAS, an Off-Target figure of –11MW.
There’s two points to make and questions to ask here:
(C4a) About Off-Target
Based on the AEMO’s operational logic (which is now reverse engineered and coded into the ‘Unit Dashboard Widget’ in ez2view) we know that this will have exceeded the Small and Large Trigger Levels and incremented a counter towards being declared Non-Conforming. As noted in the animation, however, in the 10:00 the Target (of 0MW) was reached successfully and hence the error count was reset.
For our Generator Statistical Digest 2019 project, we are contemplating reverse-engineering the Compliance Status for all units for every Dispatch Interval through 2019 and presenting on the “Second Page” results added in for each unit. We’d like to hear from you about the level of value you’d see in this type of thing?
(C4b) Why would they miss their Target
We could guess at a number of reasons why a plant might this might miss their target, on the assumption that it was automatically fed through to their SCADA system directly via AEMO. However we would rather not guess, and would like to hear from people who can help us understand why?
This particular dispatch interval was quite of interest to us, as it packed in a lot of different machinations – however that’s all we have time for now….
(C5) Structure of the rebidding for TBSF and bids “Not Well Formed”
Here’s that 10-day view from the ’Bids & Offers’ widget again:
This time we’d like to draw your attention to the comments in Orange down the bottom of the image, related to an interpretation of (and coding up to automatically parse)the AER’s Rebidding Guidelines.
———————————————————————
We’ve pieced this page together in a Glossary section of the WattClarity website to explain our understanding of Rebidding (and will endeavour to keep it updated as our understanding evolves – and as the AER’s procedures change, such as with 5 Minute Settlement.
As noted on that page, we investigated “Bids Well Formed” as one of the many different metrics analysed for our Generator Report Card 2018, and are keen to explore this further (at a discrete unit level) for our (possible) follow-on Generator Statistical Digest 2019 for publication in January 2020.
———————————————————————
In this table (and in the animation of rebids made on 6th November) we see that the form of the rebids would not pass a strict automated coding of the AER’s Guidelines. From the table in the image above, we noted the rebid reason given in the Rebid received by the AEMO on 14:00 on 2nd Nov 2019 which simply says:
E No re-bid reason. Negative Price Forecast
We wonder what happened there, to prompt this? Is the “E” supposed to represent “Error” as the Rebid Category?
(C6) Reasons behind the rebid
Looking past the structure of the rebid to try to guess the underlying reasoning behind them, I’ve tried (in the time available) to understand more – as this understanding will help us further enhance our software for the future (software which is used both by Semi-Scheduled generators to help them with their own units, but also by others to look at the activities at units that are not their own).
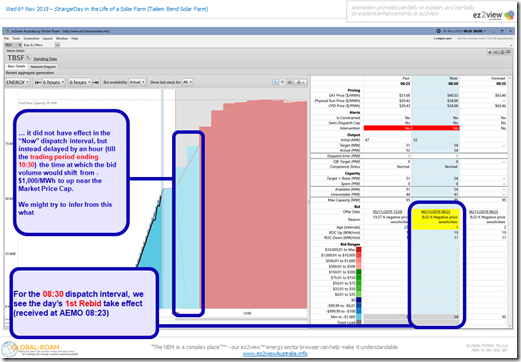
(C6a) 1st rebid taking effect 08:30
The first rebid (submitted at 08:22 and received at the AEMO at 08:23) is prior to the cut-off, so takes effect in the next (i.e. 08:25) NEMDE run for the 08:30 dispatch interval.
This has the effect of delaying (by 60 minutes) the shift in volume up to the Market Price Cap.
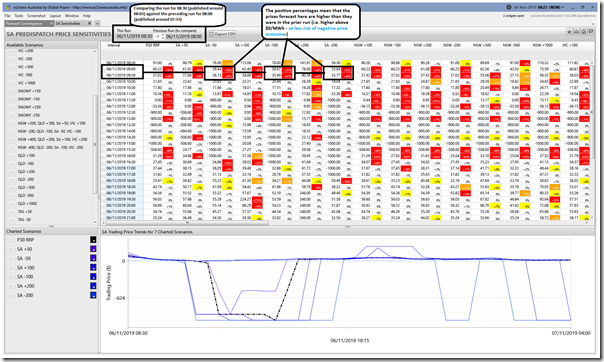
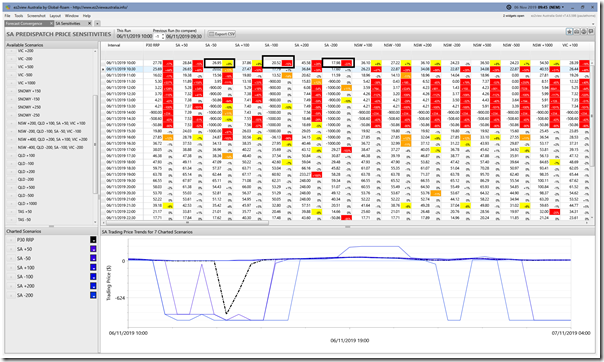
Through the rebid reason we guess that what the trader is saying is that the position of the forecast pricing in the SA-50 and SA-100 and SA-200 sensitivities for the 09:00 and 09:30 trading periods (i.e. the only ones at this end of the day affected by the rebid) looks more favourable. Because the requirement is on all participants to place rebids as close as possible to the change what prompted the reason for the rebid, we conclude that this must have been with respect to the immediately prior Sensitivity run.
Thankfully with the ‘Sensitivities’ Widget in ez2view and the more general Time-Travel functionality we can check our hypothesis against actual historical data, and are pleased to see that this matches what the data says:
The only other point I can make today about this 1st rebid is that there was a gap of about 20 minutes between when the new run of sensitivities data was published and when the rebid decision was made. Given that many of the rebid decisions (as noted in the 10-day table above) were referenced to changes in sensitivities, we would presume that the trader had ready access to some form of widget like that above to quickly compare sensitivity results.
(C6b) 2nd rebid taking effect 09:55
In contrast to the first rebid (which delayed the bid price increase) the second rebid brought it forward by 2 dispatch intervals.
Again this is referenced to “negative price sensitivities” so again we have a look at the ‘Sensitivities’ Widget in ez2view, Time-Travelled to the 09:45 dispatch interval to show the data that should have been visible at the time:
Given that the rebid really only changed price bands for the 10:00 trading period (i.e. dispatch periods 09:50, 09:55 and 10:00 not elapsed at the time the bid was submitted) it’s only really relevant to looking at the top row of the table (i.e. the change in negative sensitivities for the 10:00 trading period). In this case we see that the SA-100 and SA-200 have gone down in percentage terms, but the SA-50 has gone up, so my hypothesis of their reasoning is not as clear as in the 1st Rebid Case.
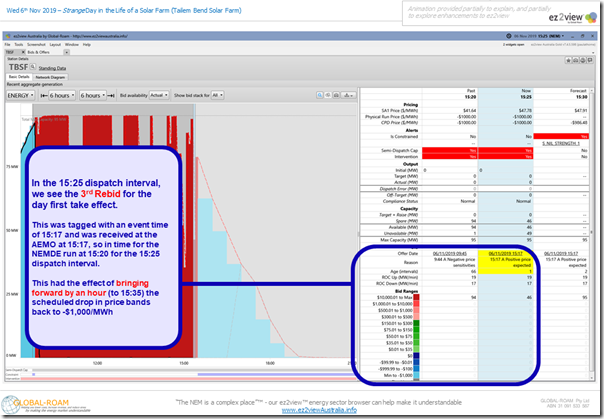
(C6c) 3rd rebid taking effect 15:25
As noted in the animation, this had the effect of bringing forward the scheduled drop in price bands back to –$1,000/MWh (which presumably happens because the trader thinks there is less risk of price dropping negative as solar winds down through the afternoon?):
Note on this instance that the trader says “positive price expected” and that this does not particularly reference sensitivities – so we wonder what this means.
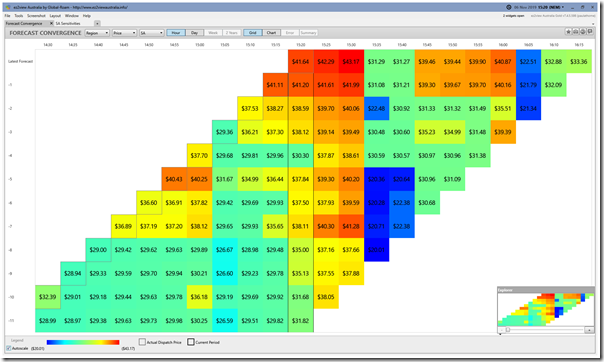
With access to the ‘Forecast Convergence’ Widget in ez2view we Time-Travel to 15:20 (i.e. the dispatch interval in which the rebid is made) and have a look at how successive P5 forecasts for the SA price were changing:
Looking up verticals (i.e. through successive forecast runs for the same dispatch interval) we see that the price colours are generally becoming warmer near the top of the table – however we do wonder about what prompted the rebid now, given that prices had been above $0/MWh for the whole day?
That’s all the rebids that were made on the day, and we have no more time to dig currently. If learned readers can help us understand these above, we would be keen to hear from them, please?
(C7) Variability in ASEFS Availability forecast
I have no more time today to post specifically about this – but was curious about some pronounced ‘bouncing around’ of ASEFS availability forecast for the plant that we can see in the progressive slides of the animation above (the dotted red line on the chart shows the availability).
We would like to learn more about what might cause this to happen so would ask that learned readers contact us about this, please?
.
(D) Do you know of people who can help us?
I posted this short note yesterday about the types of assistance we’re looking for, as I knew I would want to refer back to it on occasions like this.
If you know of people who can work with us in some way to help us help our clients better, then please let us know (or point them in our direction).
.
(E) The Generator Statistical Digest 2019, to trend some of the statistics above
We’re investigating the possibilities related to the compilation and publication of a Generator Statistical Digest 2019 covering 10 years of data to 31st December 2019 and released in January 2020. The kind of statistics shown in the ez2view images above are the types of things we’re considering including in this document as trends over time.
Yesterday I contacted a number of people via email (might be in your inbox?) to ask for their input into this process. If you have thoughts on this, we would certainly like to hear from you.


Hi Paul. We should have a chat at some stage. I like the work youy are doing.
John, our number is +61 7 3368 4064. Will email you directly.
PPA offtakers effectively pay unders and overs. For example, if the strike price is $70, and the pool price is $80, then the PPA offtaker gets a net revenue of $10 per MWh. If the pool price is $60, the PPA offtaker gets a net cost of $10 per MWh.
If the pool price goes to minus/negative $100, then the PPA offtaker incurs a net cost of minus $170, while the generator continues to get paid $70 per MWh. So PPAs have a few ways to deal with this: one method can be to limit the pool price used in the calculations to $0 per MWh. In this case, if the pool price goes to minus $100, and the generator continues to generate, the PPA offtaker pays $70 per MWh to generator, but the generator is also responsible for AEMO payments below $0, so would see a net result of (70-100) minus $30.
(You may already know all this)
Of course, AEMO payments are settled weekly, and PPAs monthly, so 30 minute pricing is less important rather than overall Dispatch Weight Average Pool Price is what counts.
But I do think this incentivise’s better outcomes. Supply should be geared to meet demand, rather than just run of plant generation. If the price is negative, it is a sign of excess supply, and supply should throttle and reduce output. This was less possible for brown coal generation historically, but theoretically much easier for solar farms.
Another weird period in the SA market was on Saturday 16 November. In the 18:20 to 18:25 interval the price was -$387/MWh, then 18:45 to 18:50 it was $5000/MWh. The Port Stanvac generator turned on, and there was no flow on either of the interconnectors for several hours. The Heywood link came back just after midnight.
Thanks Malcolm
There was much more to it than that – here’s a look at (essentially) just the first 4 dispatch intervals:
https://wattclarity.com.au/articles/2019/11/sa-islanded-on-sat16nov2019-firstlook/
Paul