Following on from Paul’s article on Queensland, this post examines the summer outlook for the other mainland NEM regions, drawing from some key AEMO publications and datasources, namely:
- the Electricity Statement of Opportunities (ESOO) published in August this year
- AEMO’s Summer Readiness Report published in November
- the MTPASA dataset providing dynamic updates of the NEM supply-demand outlook
ESOO Summary
Although it’s a ten-year outlook document serving a range of purposes, AEMO’s ESOO highlighted short term risks to supply reliability in Victoria for summer 2018/19 in the absence of actions to mitigate the risk of load shedding. AEMO’s projections of expected Unserved Energy (USE) are one illustration of these risks:
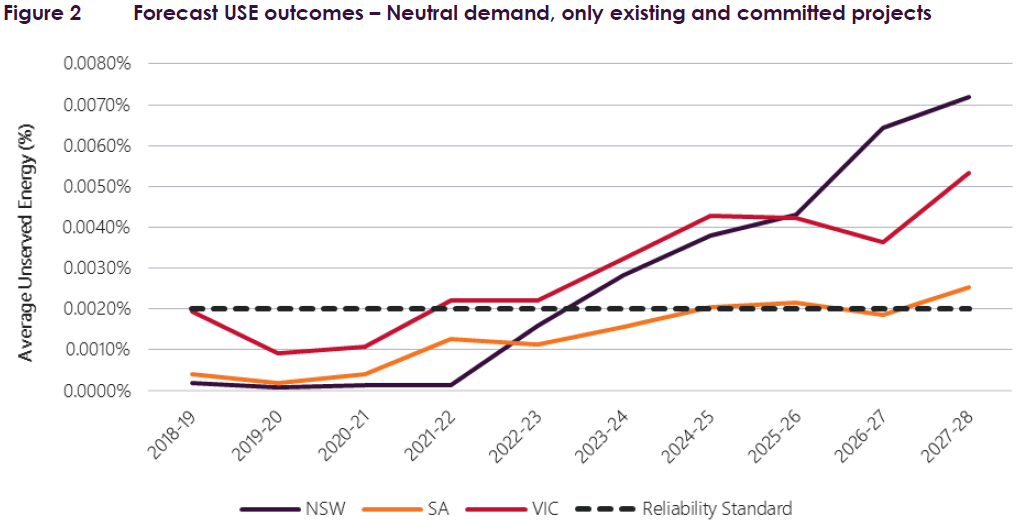
I’ll ignore the rising longer term levels of USE in these forecasts, driven by scheduled retirements of certain thermal generators and the fact that the ESOO modelling does not assume addition of new generation beyond what has been firmly committed for construction, and keep the focus on summer 2018/19. (And note that Queensland and Tasmania don’t appear in the chart because AEMO does not project any material USE in either region over the outlook period.)
While the forecast USE level of just under 0.002% in Victoria this summer seems tiny, this not a probability but expresses AEMO’s estimate of the quantity of load that might be shed (averaged across hundreds of modelling runs) as a proportion of Victoria’s total annual load – further details in this short explainer which I put together after last year’s ESOO publication. AEMO is at pains to point out in the ESOO that in the absence of mitigating measures, it assessed the probability of some load-shedding occurring – so-called “Loss of Load Probability” (LoLP) – to be quite material, particularly in Victoria:
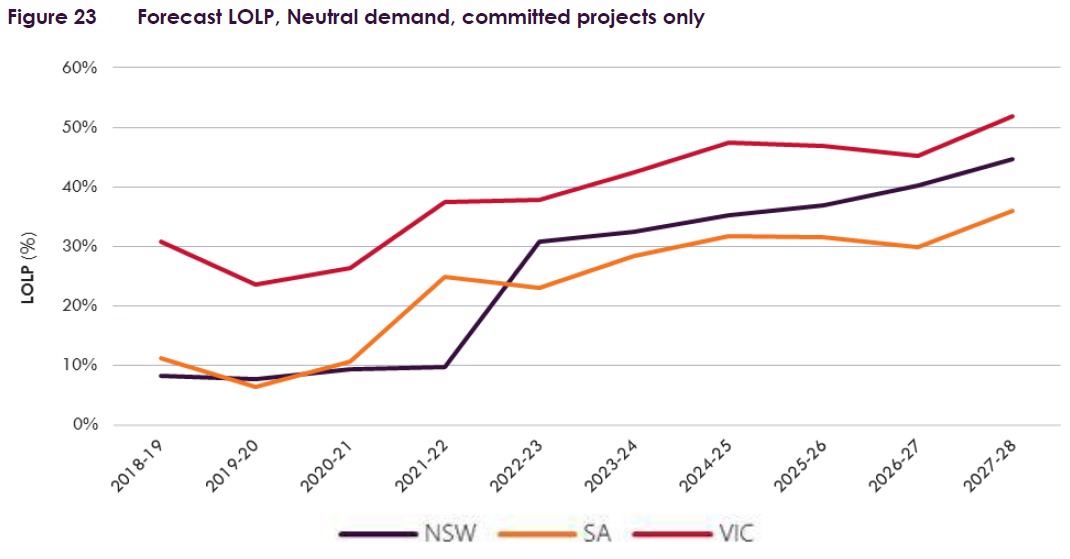
Actions proposed by AEMO to address these risks are outlined in both the ESOO and in the more recently published 2018/19 Summer Readiness Report.
Reliability – AEMO’s Role
The reliability levels (expected USE, LoLP etc) projected in documents like the ESOO are essentially AEMO’s assessment of what the energy market could deliver, given only existing and firmly committed supply and demand resources, in the absence of any central intervention / mitigation such as procurement and use of out-of-market reserves to avoid physical load shedding. The NEM market design, and particularly the reliability settings within that design, are intended to provide market signals – principally via spot and forward prices – to induce commercial participants to invest in supply or demand side capacity sufficient to deliver a defined, high level of reliability (albeit not perfect!) But there has always been provision under the market rules for AEMO to act as a “provider of last resort” where it assesses that participant investments and actions are insufficient to meet reliability standards. Events over recent years, including blackouts and generation retirements, have greatly increased focus on NEM reliability. Nor have they given much comfort that the NEM reliability framework is well understood or that load-shedding of any description is politically acceptable.
One consequence of these events and scrutiny has been much more openness from AEMO on its role in managing and coordinating real-time reliability, exemplified in publications such as the Summer Readiness Reports produced in the leadup to last and this summer. And given the tighter supply-demand balance following plant retirements and some evidence of higher generation outage (breakdown) rates, both of these factors pushing assessed reliability levels in Victoria outside or very close to defined thresholds (ie the NEM’s USE standard of 0.002%), for the 2017/18 and 2018/19 summers AEMO has contracted out-of-market supply and demand side resources intended to be used only to “keep the lights on” where the market by itself might not do so.
Summer Readiness Report
AEMO’s latest Summer Readiness Report builds on the ESOO analysis described above, concluding that some 120 – 525 MW of additional capacity across Victoria and South Australia might be necessary to maintain adequate reliability under extreme but plausible conditions, and provides details on the out-of-market reserves AEMO has contracted, and other reserves potentially available for short notice contracting (often in the form of demand reduction), in the event of reliability threats.
In brief AEMO
- has currently contracted firm access to 130 MW of resources in these regions;
- is assembling a portfolio of 400 – 800 MW of reserves available for short-notice contracting if required
The readiness report also outlines many other steps being taken by AEMO, networks and participants to maximise operational availability of generation and transmission capacity over summer.
Tracking Supply/Demand Balance – MTPASA
The reliability assessments published in the ESOO and Summer Readiness Report are necessarily point-in-time estimates. In a dynamic market like the NEM, actual supply and demand conditions vary greatly, and forecasts of maximum demands and generation availability can change over time as new information becomes available.
AEMO’s suite of PASA reports provide updates in near real time of changes in regional supply/demand balances over various horizons. The MT (medium term) PASA reports published weekly provide data at daily resolution out to two years ahead and provide the principal dynamic view of potential demand and available supply levels for the current summer.
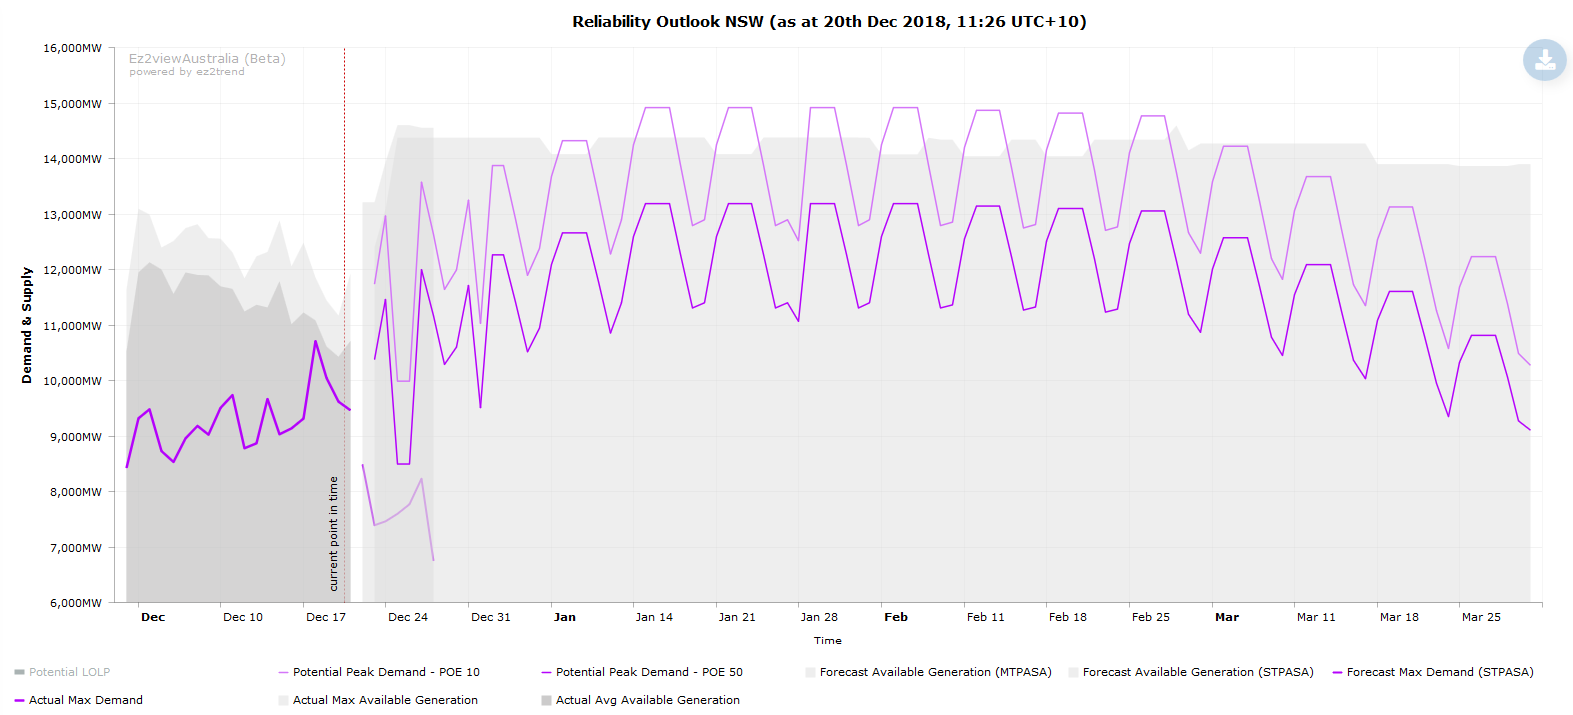
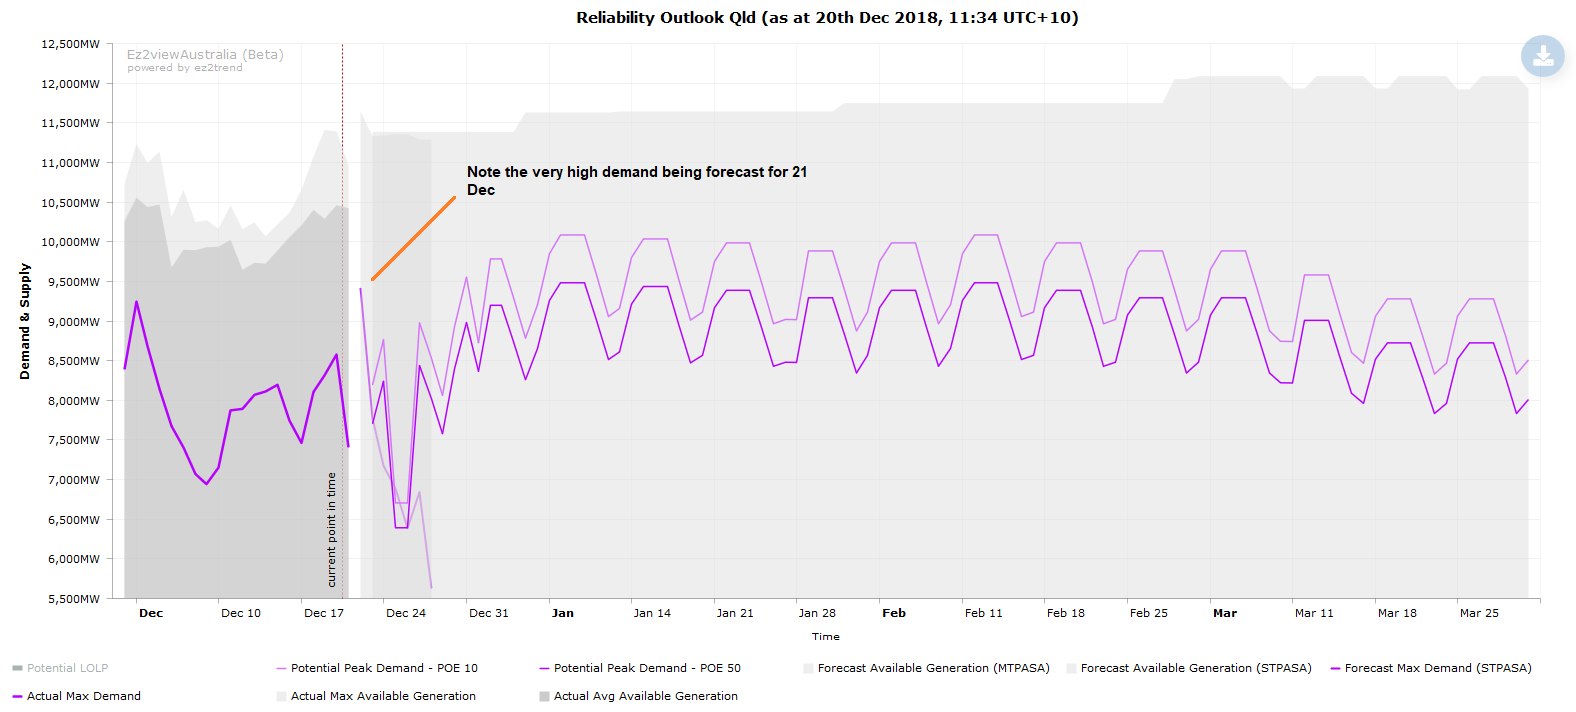
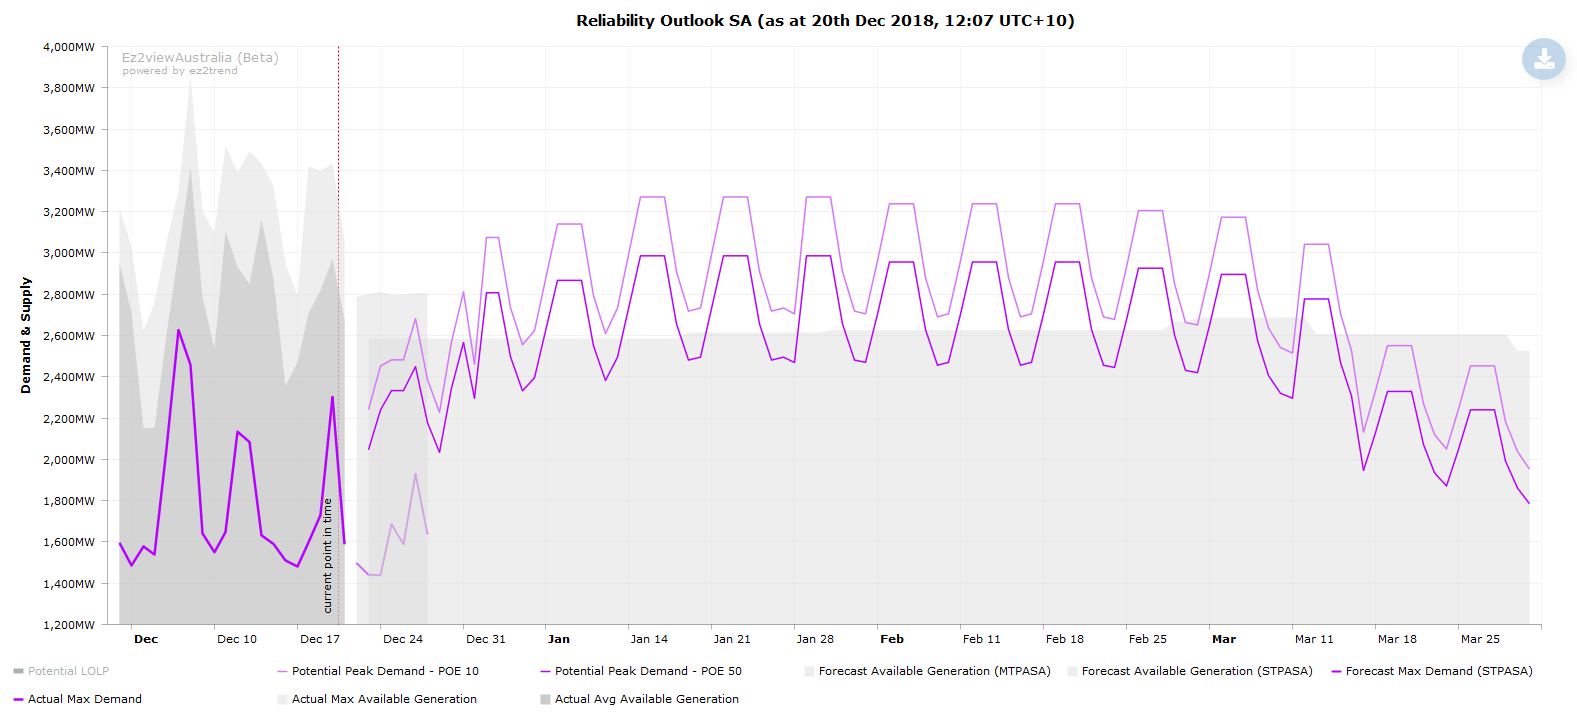
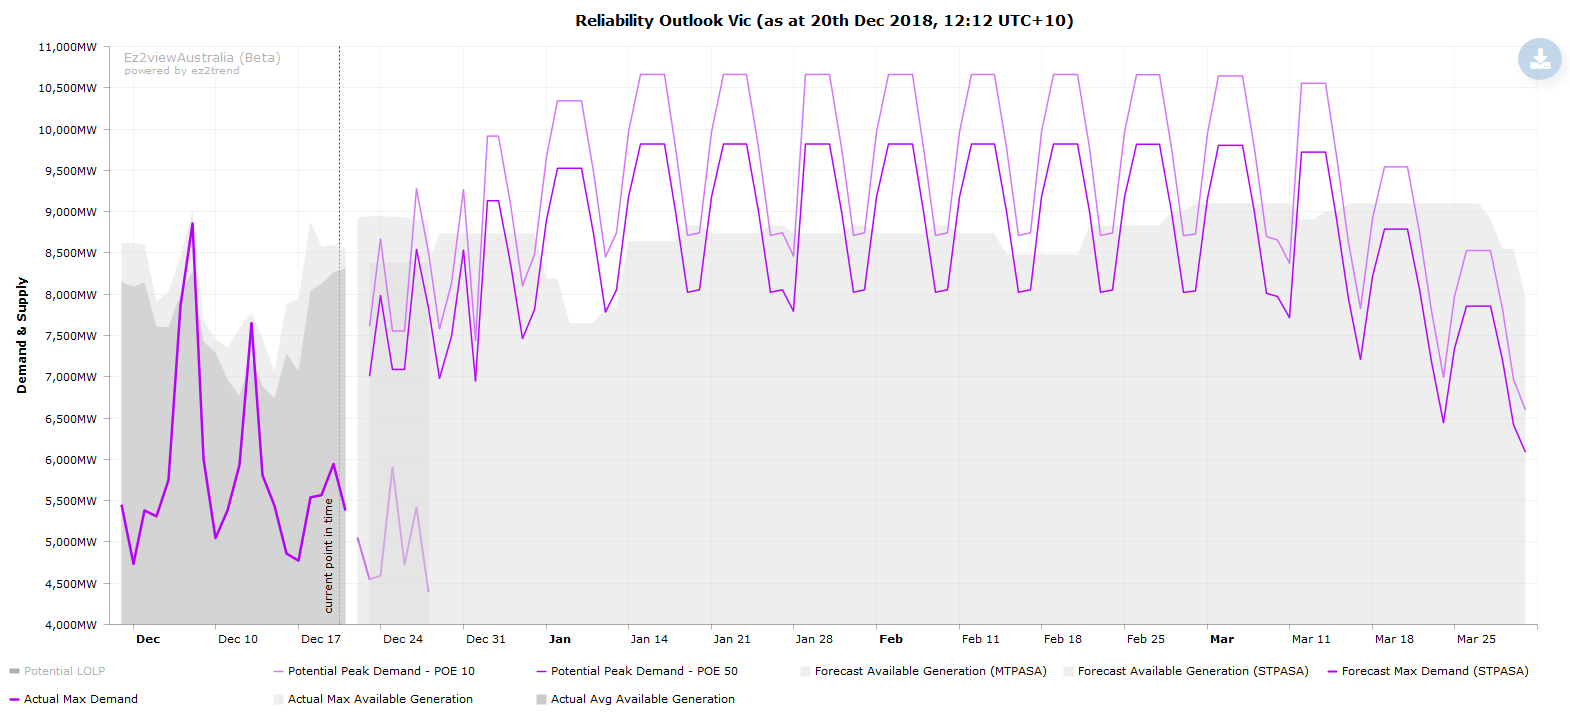
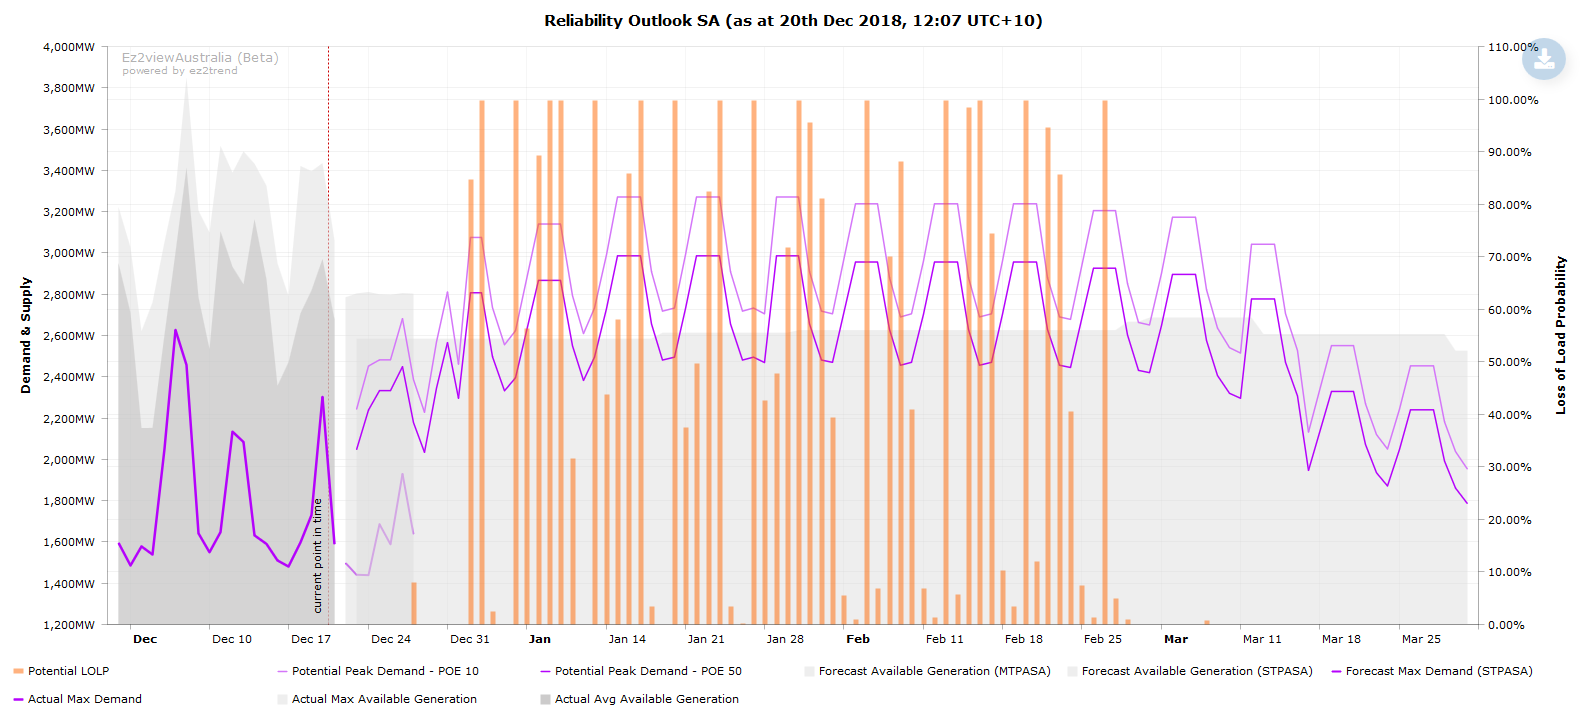
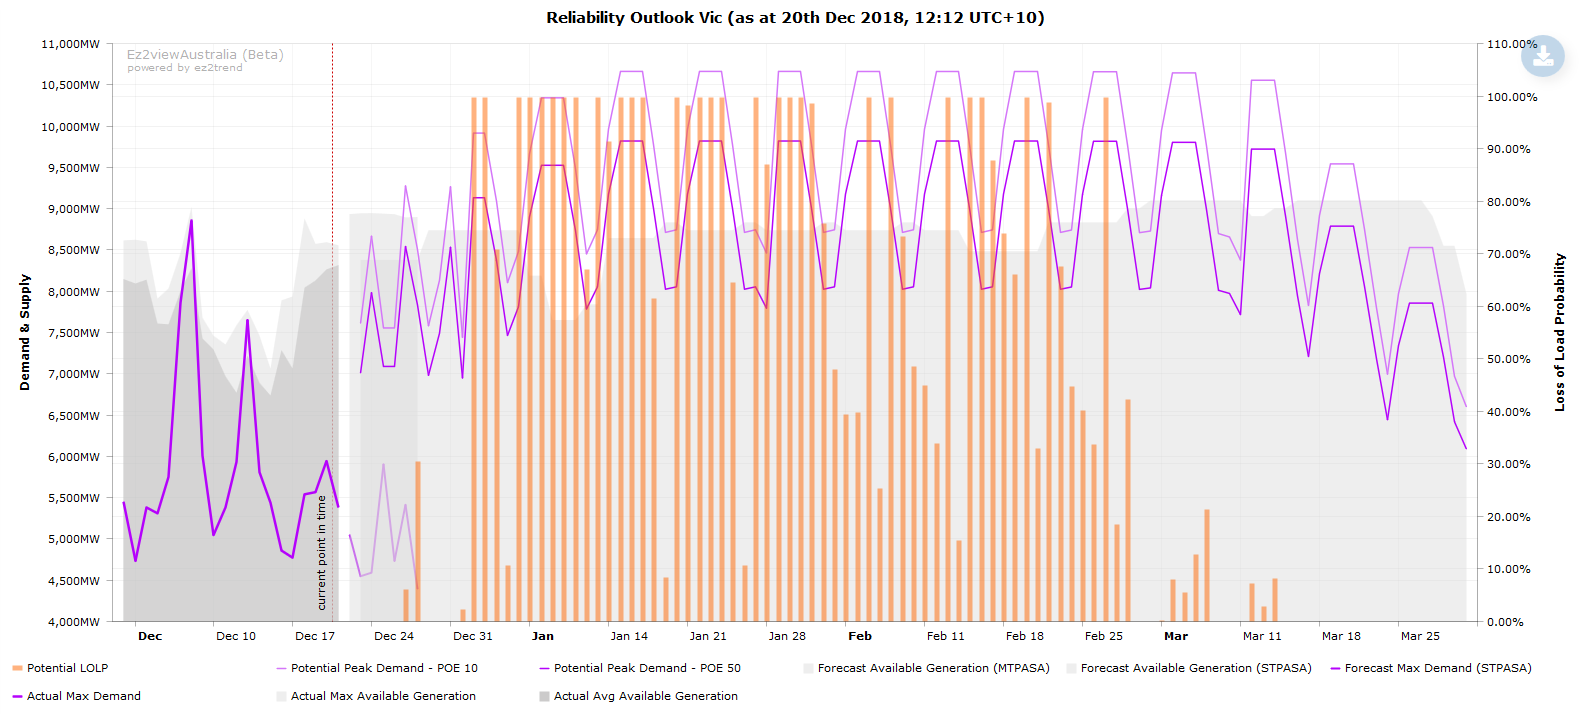
In the charts below, produced using the data-rich ez2view trend engine, I’ve built on Paul’s original view of supply/demand balance for Queensland to show the current picture in the other mainland NEM regions:
(For registered ez2view users, template copies of these charts can be accessed through the following hyperlinks: NSW, Qld, SA, Vic)
Like most AEMO data, quite a bit of context is required to interpret these charts. In particular:
- the Potential Peak Demand lines, sub-labelled POE 10 and POE 50, represent estimates of the demand level that might be reached on each day in the plot if weather conditions on that day equated to the hottest expected for a whole summer, with POE 10 (= 10% Probability of Exceedence) being a 1 year in 10 hot summer and POE 50 a 1 year in 2 (or median) summer. Obviously in reality actual temperatures and demands will be well below these levels on nearly all days of the summer other than the hottest – but no-one knows in advance when that day might occur. So these lines represent not “forecast” demands but “potential maximums” across the range of summer dates. There is a clear weekly patterning to the data showing highest potential demands in the middle days of the working week, as well as a seasonal profile showing concentration of the highest potential temperatures and demands in January and February.
- the Forecast Max Demand (STPASA) line running out for ~7 days is a short term demand projection based on actual weather forecasts
- the historic Actual data for Demand and Available Generation use different measurement bases from the PASA forecasts, in particular the forecast available generation line excludes contributions from variable renewable (wind and large scale solar) generators – their potential contribution is accounted for elsewhere in the MTPASA reliability assessment. The historic data include levels of renewable generation that were actually available (hence their variability).
- Interconnector import capability is not included in the supply available these charts – this capability is also highly dynamic depending on supply/demand balance in adjoining regions and on network constraints. As for variable renewables, assessing the contribution of interconnector capability to reliability is done at a granular level in probabilistic modelling of supply/demand balance and can’t readily be represented in higher level charts like these.
- Very importantly, the data do NOT include contributions from any out-of-market reserves already contracted or available to be contracted by AEMO. Supply and demand levels reflect those resources available for in-market dispatch only.
Despite all these qualifications, the charts provide a view of supply/demand balance which is useful for assessing trends across time and clearly indicate which regions (ie Victoria) would be most reliant on out-of-region (interconnector) or out-of-market (AEMO reserve) support to meet extreme demand levels, if experienced.
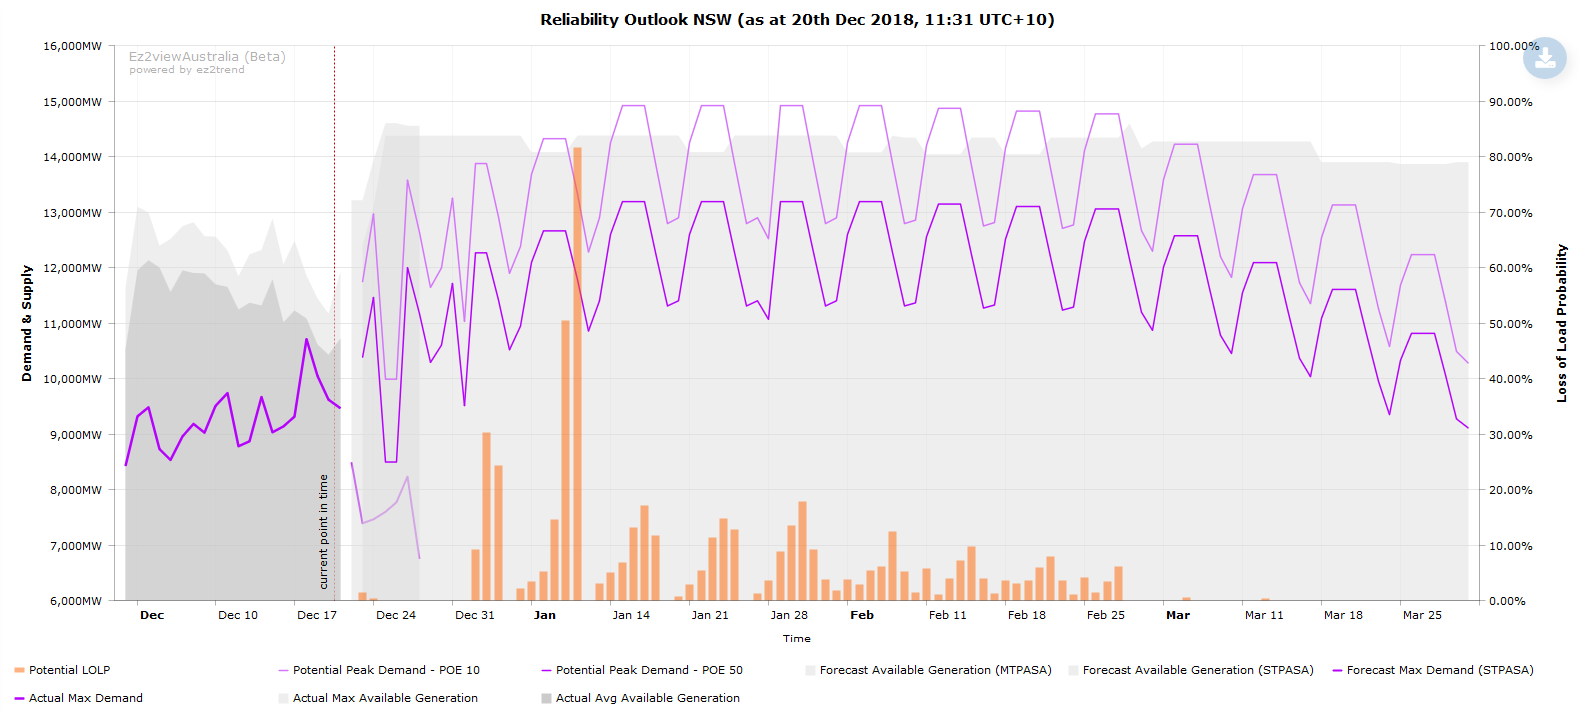
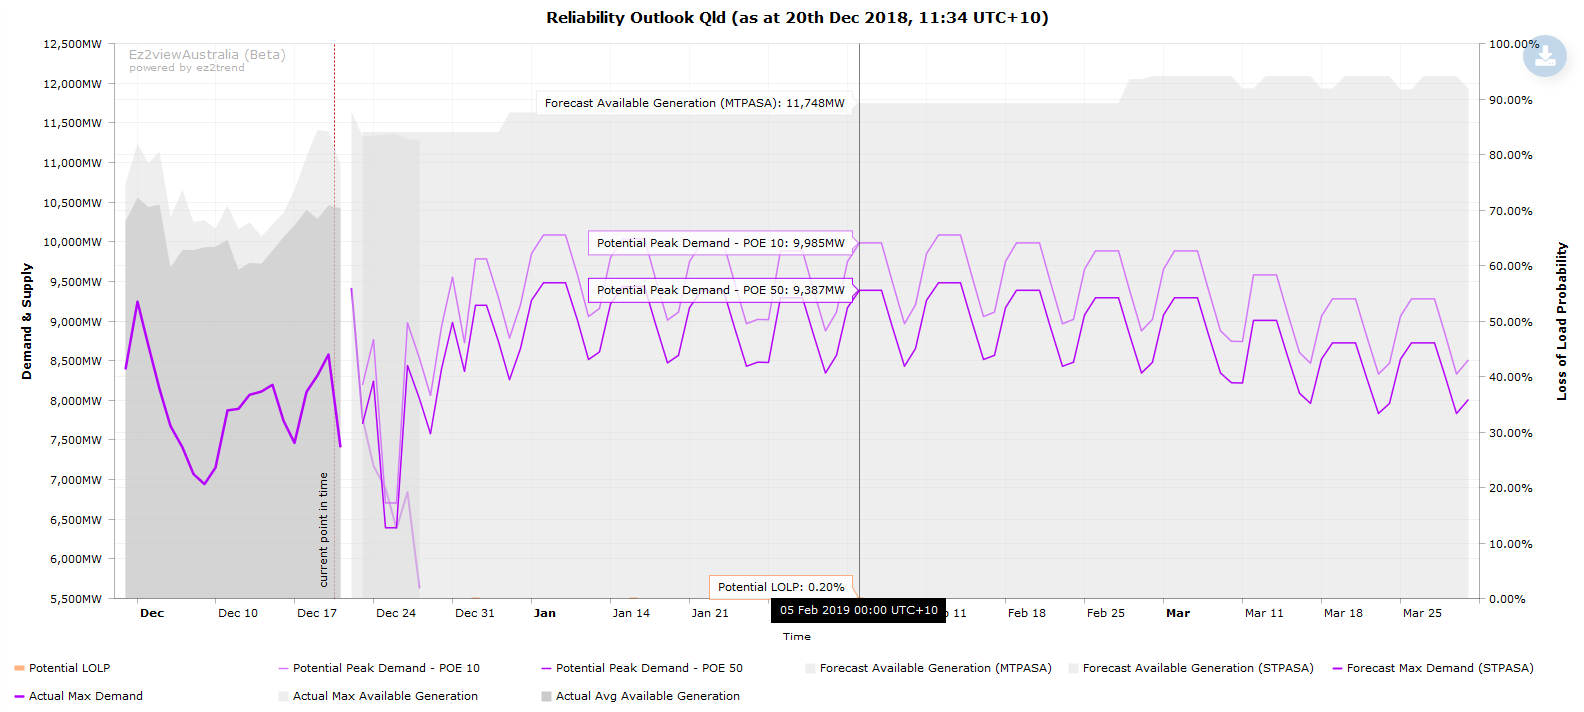
AEMO has recently modified its MTPASA processes to also produce a day by day assessment of LoLP, included in its suite of MTPASA reports. Adding the results of this calculation to the above charts produces data that look positively horrifying – particularly for Victoria:
(Copies for registered ez2view users here: NSW, Qld, SA, Vic)
However a number of important provisos apply:
- like the Potential Peak Demand series, the daily LoLP estimates are calculated as if highest-in-summer temperature / demand conditions were to occur on each day assessed
- underlying data (not plotted) indicate that the LoLP calculations appear to use a demand scenario that is in some cases even more extreme than the MTPASA’s POE 10 level (the reason for this has been queried with AEMO, response awaited)
- the LoLP assessments also appear to use a relatively “pessimistic” assessment of variable renewable contribution
For those really interested in the details, AEMO’s MTPASA documentation provides more background. For other readers, the key takeout is that these Loss of Load Probabilities are NOT even remotely forecasts of the chance of the lights going out. There are best read as the likelihood, for any given day in the forecast horizon, that AEMO would need to activate out-of-market reserves to maintain supply if a combination of extreme weather conditions and lower than expected supply were to occur on that particular day – which is inherently a very unlikely event. As such, the LoLP values shouldn’t be interpreted as absolute probabilities, but only as indicators of relative levels of reliability across time and regions.
We’ll watch with interest how these views evolve over summer, and provide commentary here on WattClarity of any notable events. Hopefully not too many though!
About our Guest Author
 |
Allan O’Neil has worked in Australia’s wholesale energy markets since their creation in the mid-1990’s, in trading, risk management, forecasting and analytical roles with major NEM electricity and gas retail and generation companies.
He is now an independent energy markets consultant, working with clients on projects across a spectrum of wholesale, retail, electricity and gas issues. You can view Allan’s LinkedIn profile here. Allan will be sporadically reviewing market events here on WattClarity Allan has also begun providing an on-site educational service covering how spot prices are set in the NEM, and other important aspects of the physical electricity market – further details here. |


At least somebody is discussing this risk. Not likely to be discussed much over at the toxic bubble that is RenewEconomy…
I’d also draw attention to the AEMO SA Electricity Report 2018, which amongst several other worrying statements, has this to say on page 5 within the executive summary:
“AEMO forecasts risks to supply in the next five years in South Australia, due to the region’s interconnectedness with Victoria. To avoid unfairly penalising one region for a supply deficit spread through several interconnected regions, an equitable load shedding principle applies in the NEM. This principle states that load shedding should be spread pro rata throughout interconnected regions when this would not increase total load shedding. Therefore, while the reliability standard is not expected to be exceeded in South Australia, high risks of load shedding projected in Victoria are likely to result in any supply deficit being spread across both Victoria and South Australia.”
Equitable load shedding principle?
Load shedding should be spread pro rata throughout interconnected regions?
Deep state is upon us.