Back in October 2018, we alerted our readers to the intention to prepare an extensive report card looking in detail at every single power station for which AEMO supplies data in the Australian National Electricity Market.
Since that time, we thank those early-birds who have jumped at the chance to secure a heavily discounted copy of the report in advance of us completing any analysis. The savings they have made are our reward to them for the trust they have invested in us to complete high quality analysis.
That early bird rate expired at the end of 31st December 2018 – but there is much still to do in the completion of the Report Card, so we are happy to extend a still discounted price for those who wish to send in an early order for the Report Card between now and when the report card is finally released (we expect in about 8 weeks).
The new Order Form is here.
For the benefit of those who asked before, if you don’t want to pay by credit card but would rather us invoice you when the report is available, please let us know when you send the form back to us.
Over January and February, we will be heavily focused on the completion of the Report Card – we look forward to delivering this to our clients upon completion.
(A) Three main components of work to be completed
In the compilation of this report card, there are essentially three main components of work we are focused on in rough sequential order:
Work Component #1 = data compilation
Now that we’ve ticked over into 2019, we can start to crank the handle in the derivation of the range of (commercial, technical and other) metrics we have identified to cover the range of power stations operating in the NEM. We have compiled a list of more than 100 metrics and are investigating data for all of these.
Not all of these metrics will find their way into the report – but it does provide some basis for understanding the level of rigor we are applying to this task.
Work Component #2 = analysis and insight generation
Once the we data sets have been assembled, we will distribute these to a team of analysts – with each analyst responsible for independent review of the data and production of a series of Key Insights from the data sets that will be collated, and hence form the basis of what we draw from in completion of part of the Report Card.
Our team includes both:
(a) people within Global-Roam and our partners in the Report Card, Greenview Strategic Consulting; plus
(b) a selection of external analysts we have hand-picked for their ability to work independently from us and each other to review the same data set and ensure we (collectively) identify the most useful insights. Some of these external analysts are already guest authors on WattClarity.
Work Component #3 = preparation of the Report Card document
The Report Card is being developed to include a focused report card page for every individual power station (and battery). The core metrics that tell the most important stories will be included on these report card pages.
On top of this, the compiled list of Key Insights (some market wide, and perhaps some specific to regions or fuel types etc…) will be compiled, ranked and included in the report.
All-together, the report will span hundreds of pages.
(B) Early insights, about the spread of transmission constraints
One of the significant parameters (technically) that all generators should be keenly aware of is the nature of constraint equations – how they can affect both the price outcomes in the regions you care about in the market, but also the dispatch of Scheduled and Semi-Scheduled generation.
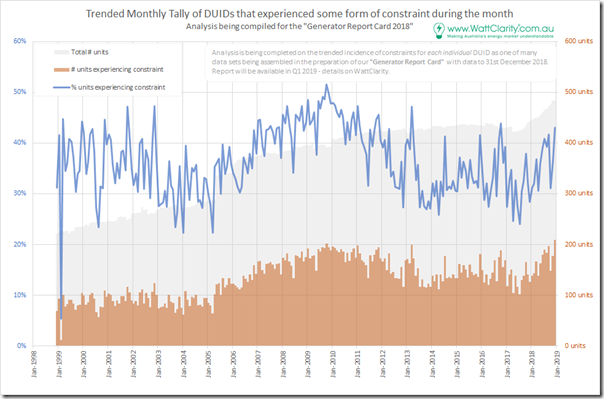
For our Report Card, we have started the preparation of a number of metrics relating to the effect of different types of constraint equations on unit targets. As a simple first case with preliminary data, in the chart below we trend a count (and percentage) of the number of units subject to any form of bound constraint equation during a given month:
We see that, for most months, the percentage of DUIDs subject to constraints is somewhere between 30% and 50% (up to 200 DUIDs affected each month).
In our Report Card we intend to explore, for each power station, which are the most significant constraint equations from their perspective.
The specific units affected, the constraint equations (and their specific purpose), and the relative incidence will all vary over time – we are in the process of exploring, to report further.
For all of those new generation developers who read WattClarity, particularly those who have minimal prior experience in the NEM (some of whom might be currently thinking “my project won’t be affected”, or even have been told that by others), you might want to reflect on the trend of this historical percentage incidence and think about the chances that your own projects will avoid being subject to transmission constraints?
——-
PS on Wed 2nd Jan 2019
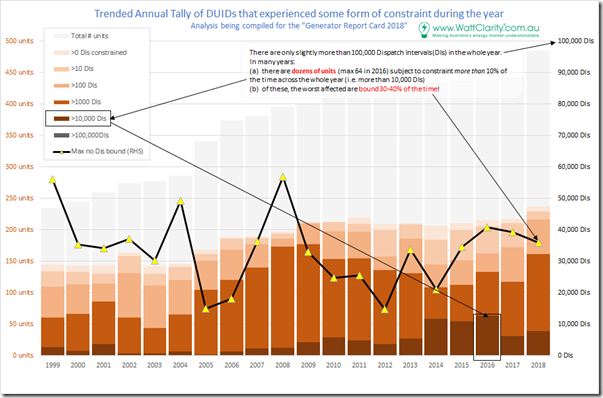
Intrigued by some of the numbers that were extracted above, we aggregated the data to annual and present them in trended distributions in the second chart below:
Three things particularly stands out to me in this chart:
1) When looking across a whole year, we see that it’s quite common for 50% of all DUIDs that are operational in that year to experience some form of constraint.
2) For DUIDs when this happens, they almost always experience at least 100 Dispatch Intervals of bound constraint (i.e. quite rare to be greater than 0 but less than 100).
3) In many years recently we see dozens of units (DUIDs) which are subject to constraints at least 10,000 Dispatch Intervals in a year (i.e. more than 10% of the time) and sometimes up to 40,000 dispatch intervals (i.e. 40% of the time). Amongst these, I suspect, will be Semi-Scheduled (Wind and Solar) units subject to the System Strength constraint in South Australia – the work we are doing in the Generator Report Card 2018 will reveal the specific units.
The main take-away, here, is that constraints are obviously not a peripheral consideration for any unit.
——-
(C) Send back your completed Pre-Order Form, or give us a call to discuss
The updated Order Form is here, with a discount available for orders received prior to the publication of the report. Just a lower discount than for those who placed their orders (with our appreciation) prior to 31st December 2018.
If you would like to discuss the Report Card please call +61 7 3368 4064.


Leave a comment