It’s Tuesday 6th January – so (counting today) entrants only have only 4 days remaining to submit their forecast for what the peak NEM-wide demand will be this extended summer period (1st Dec 2014 to 31st March 2015).
This year there are 7 competitions running in parallel (further details of all 7 here) but, like prior years, it’s your forecast for peak NEM-wide demand that sets you up to win the main prize (Competition #1). Because entrants only get one chance with the main prize, many have been holding fire until this week (shortly to be updated here) to place their entries for Competition #1.
The following analysis might help them – and it can help you as well…
1) The extremes of prior summers
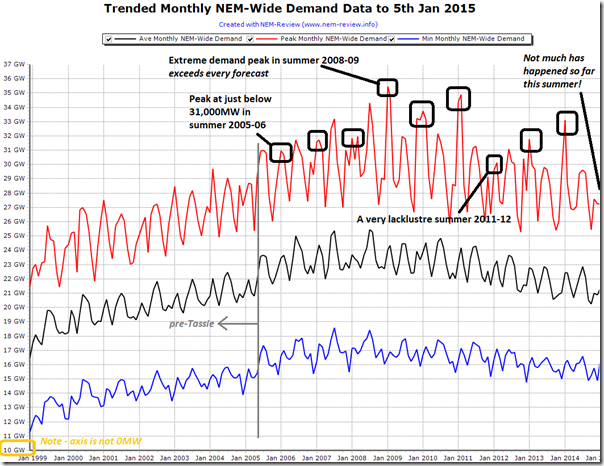
With NEM-Review we have generated the following trend of demand extremes for every month since the start of the NEM, up to and including January 2015, but to only yesterday 5th January.
Looking back over prior summers in particular, I note the following summaries previously provided at the time:
Summer 2013-14 Following summer 2013-14 we posted this summary of highlights of how NEM-wide demand trended through the summer period.See in particular how there were only two separate hot spells during which demand rose above above 30,000MW – one of them being the week of Thursday 16th January, which was when the NEM-wide demand peak at 33,223MW. An AEMO staff member (Magnus Hindsberger) use a very scientific process to ensure he was within 0.26% of the mark. You might like to read Magnus’ comment at the bottom of this article, where he explains some of his method.
Summer 2012-13 Summer 2012-13 saw fewer instances of demand peaking above 30,000MW – as shown in this summary published in March 2013. The peak for that summer was 31,846MW.As noted here to follow, it was Joy Chan (of Delta Electricity) who just scraped past other colleagues at Delta, and the rest of the entrants, with an entry just shy of the mark – in a summer where the peak demand crept close to 32,000MW. Summer 2011-12 The La Nina summer of 2011-12 was very lacklustre (as shown here), where the demand just scraped past 30,000MW on one day – and, on that day (24th February) it peaked at only 30,218MW.Winning entry from that summer was Aden Fanning (of InterGen). Summer 2010-11 As shown in this trend for summer 2010-11, demand barely budged above 30,000MW – except for one stinking hot week where demand peaked at 35,004MW on Wednesday 2nd February 2011. Winning entry for summer 2010-11 came from another AEMO staff member (Richard Hickling) who was – compared with winners in other years – further from the mark, but still close enough to win. Summer 2009-10 We did not run a competition over that summer period – must have been too busy?However we still did record in WattClarity these pieces of analysis of noteworthy events over the summer period. Summer 2008-09 The massive demand peak of 35,478MW (discussed here) set on 29th January 2009 might be (it seems) a record that stands for more years. At the time of writing this article, it is a peak that has not been bested.Various articles linked to analysis of this broader summer are included here. Every single forecast was blown out of the water in that summer – with the “least wrong” being Thao Doan (of Stanwell).
Summer 2007-08 We also did not run a competition for summer 2007-08.There were a number of interesting developments over that summer period, including:
(a) A very volatile weekend in Queensland; and
(b) The extended heatwave experienced in South Australia through March 2008, if we’re using the current extended definition of summer.Summer 2006-07 Through summer 2006-07 we posted this series of articles in a summer that included a significant blackout.Winning entry this summer came from David Turnour (of Origin) – who was 129MW from the mark (0.4%) Summer 2005-06 In summer 2005-06 the daily peak demand rose above 30,000MW on perhaps 6 instances (as shown here), with the highest excursion being to 30,994MW late in January 2006.The winner for this summer was Trevor Persal (of Ergon Energy). Note, in the post linked here, the distribution of entries – and how most forecasters were way over the mark. Hence, the above summary of 9 prior summers (since Tasmania joined the NEM) reinforces how the demand – most of the time – has remained below 30,000MW for much of every summer period.
On the occasions when extreme temperatures has driven demand higher, the peaks for the summer have been very much dependent on weather extremes in either NSW, or VIC+SA. We have not really seen extreme temperatures in QLD or TAS contribute to peak NEM-wide demand thus far… (or, noting another way, when extremes of demand were experienced in QLD in particular, demand in the south has been very moderate).
2) Trended distribution of NEM-wide demand
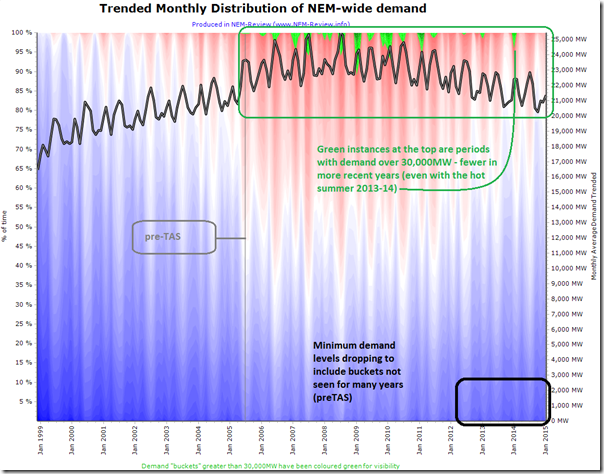
To provide a little more context to help you with your single forecast for the main competition this summer, we’ve used NEM-Review to generate the following trended, coloured distribution of the incidence of NEM-wide demand each month (colouring the counts of demand in buckets above 30,000MW in green – as this is the area of particular interest to you).
This follows from this analysis leading into summer 2011-12, whereby in that case we aggregated up just to the (regular) summer periods of December, January, February. Note, in particular, that this prior analysis preceded the demand spikes above 33,000MW in summer 2013-14.
3) What does AEMO forecast for peak NEM-wide demand
In the past couple weeks, as time has permitted and especially because each region has also been the focus of its own competition this summer (with more than one entry accepted for each of these).
Queensland
(Competition #2)On Christmas Eve, we posted this analysis of prior Queensland summers – and included some tips on what AEMO’s current forecasts suggest for what the peak regional demand for QLD might be this summer.Several readers have left clarifying comments, and forecasts have continued to be submitted each day since that time. NSW
(Competition #3)We’ve not yet had a chance to provide a summary for NSW, and to update AEMO’s forecasts for that region – perhaps if time permits later this week, in time for your last entries. Victoria
(Competition #4)On Friday 2nd January we posted this analysis of prior Victorian summers, and included some tips based on what AEMO’s forecasts are saying for peak Victorian demand this summer. South Australia
(Competition #5)On Monday 29th December we posted this analysis of prior South Australian summers, and included tips based on what AEMO’s forecasts are saying for peak SA demand this summer. Tasmania
(Competition #6)On New Year’s Eve we posted this analysis of prior Tasmanian summers, and included tips on AEMO’s forecast for the region.The consistency highlighted suggests (as noted in the article) the need to fine-tune your forecasts, certainly down to nearest whole number! The key message here (in terms of peak NEM-wide demand) is that, unlike peak regional demand, the AEMO does not really give you a hand, explicitly, by providing any forecasts for what the peak demand is likely to be across the NEM this summer.
Now that you’ve considered the background above, don’t forget to email in your forecast for peak NEM-wide demand for extended summer 2014-15. You only get one entry, so make sure it counts!


Leave a comment