

Lets take a revised look at supply-side capacity in the NEM over the next 10 years. 10 years is the ESOO time horizon.
We’ve labelled this version 1, to allow for adjustments. We might adjust the approach to groupings as our thinking evolves.
Capacity over the next 10 years
The design of the ESEM helps us consider supply of energy through the lens of three main service types:
- Bulk energy,
- Firming,
- Shaping.
To chart capacity we group existing units and future projects into these service types.
In previous years we charted aggregate output capacity of fully scheduled resources to gauge how much of the existing and future supply side fleet can provide firm energy. Of course, this is only part of the wholesale energy production picture. Variable renewable energy resources are also a key component, just not firm.
Generally, technology types are better suited to one specific service which has aided the grouping:
- Bulk energy : Large-scale wind and solar (VRE), being variable near-zero SRMC generators.
- Shaping: Batteries and hydro, having limited energy available relative to capacity.
- Firming: Thermal generation, being not energy limited typically.
For the purpose of this article I’ve lumped all hydro projects into the shaping service category. Note, we anticipate that very long duration storage technologies will be capable of providing firming. Different technologies aren’t limited to providing a single service. And Snowy 2.0 is reported to have over 6 days of storage duration when storage levels are full: very long duration storage.
Stemming from prior focus on fully scheduled capacity (we still need scheduled supply) a further service “perspective” is represented as:
- Fully Scheduled Resources, combining units identified for firming and shaping services together.
ESOO Development Scenarios, + one
A discussion on ESOO scenarios was had here, and later reflected on here. So we won’t go into detail on what they represent here.
In the 2026 ESOO:
- Committed + Anticipated projects represented a base development case.
- Government Schemes and Actionable Developments is more ambitious on development speed and volume.
We add, for context, one more development “perspective” covering:
- Committed projects only.
The matrix
Capacity outlooks for 4 service types and 3 scenarios produce twelve series. At the high level and to orient ourselves the matrix of scenarios looks like this:
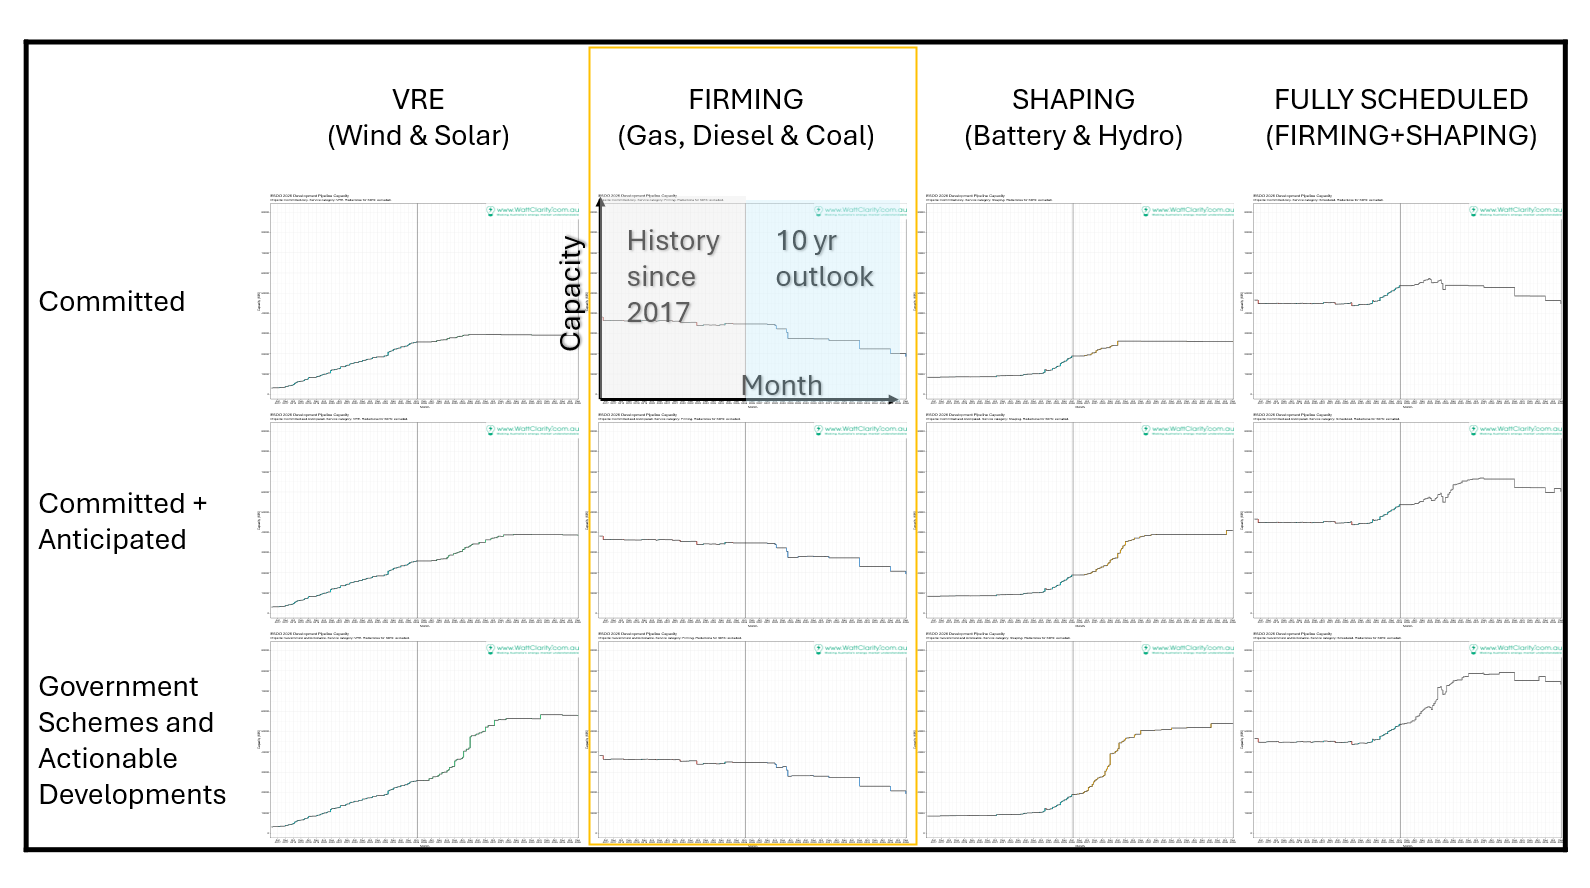
Scheduled and semi-scheduled resources are included. We included existing units from the date they became effective in the market which produces a flatter start to the outlook period as existing projects, present in the historical series but not yet at full commercial use, are removed from the outlook dataset to avoid double-counting. We don’t discount capacity reserved for SIPS in these versions. The outlook projects are included with nameplate capacities, there are no seasonal deratings included. We derived the historical series using max capacity. For closures, therefore, we remove the same value.
By service group
Rather than 12 individual charts, and to aid comparison, we chart the outlooks by service group (e.g. orange box from above) in the next 4 sections..
Bulk Energy
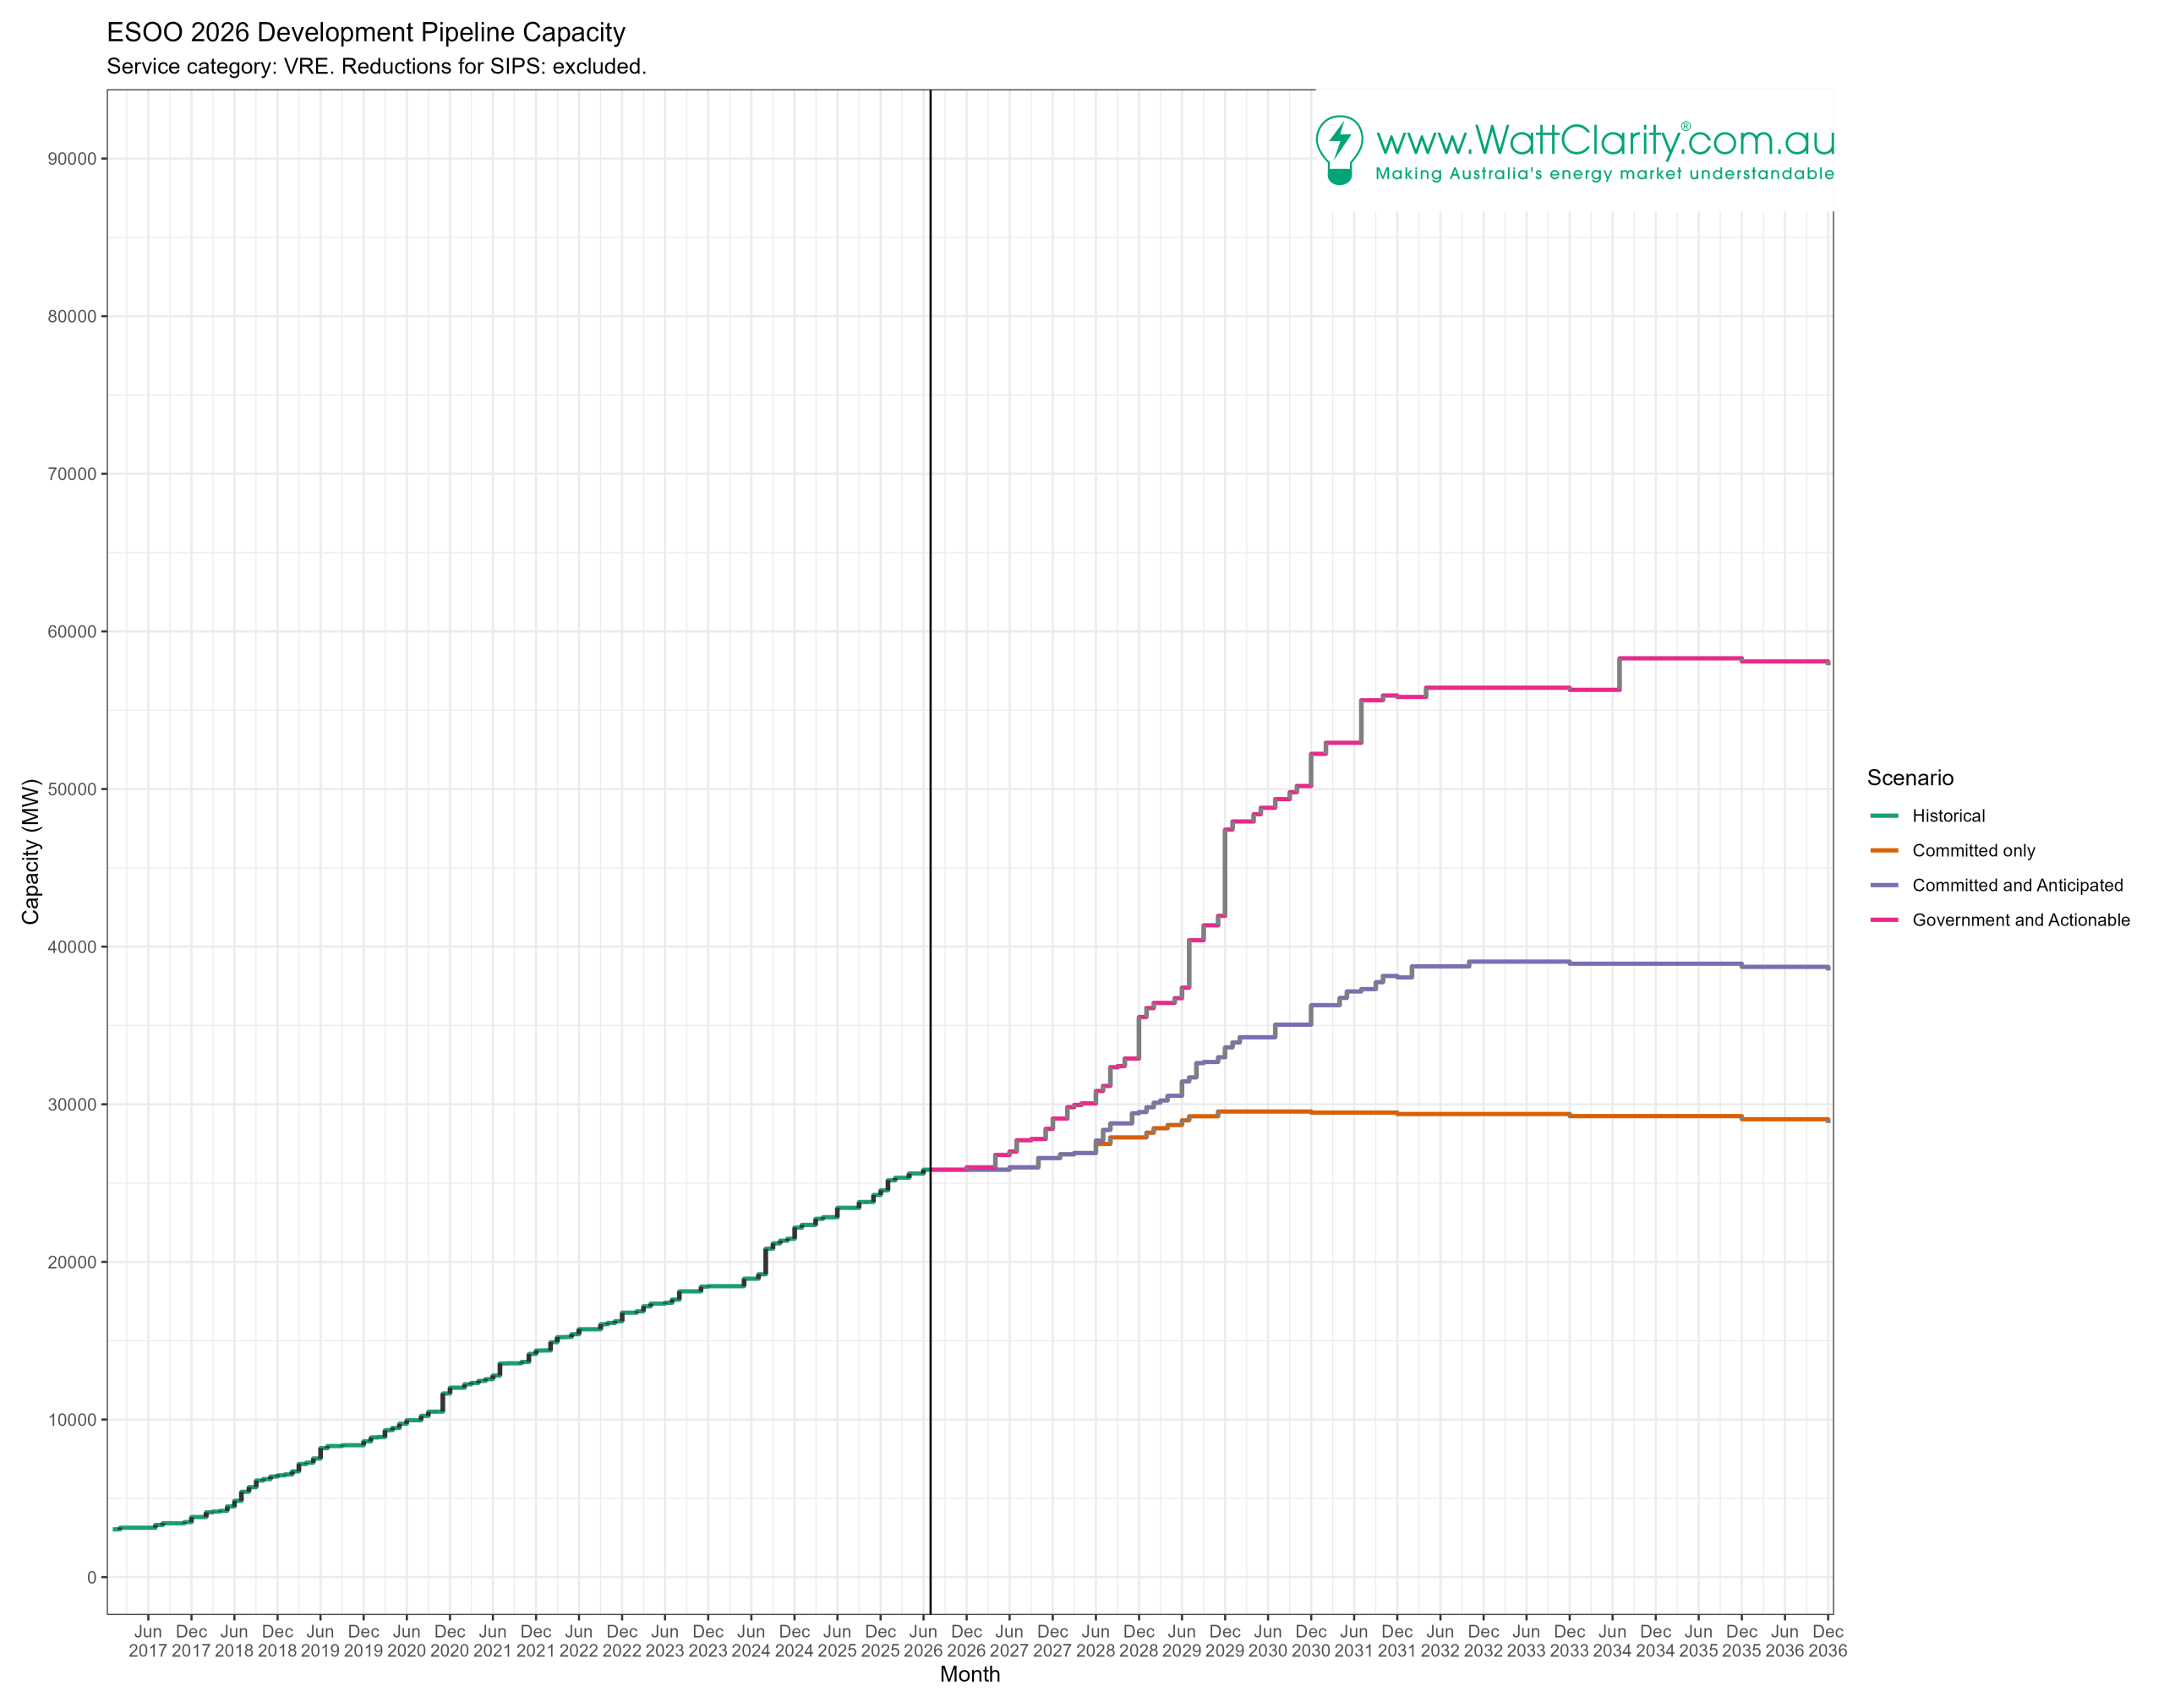
One thing that stands out in this category, and in all three, is that outside of the next 2-3 years no projects are assigned committed status.
Yet it is plausible to anticipate that we will build something in the next 7-10 years. Anticipated VRE projects add almost 10 GW on top of the nearly 30 GW that is presetly committed or existing by 2036. The trend of this scenario’s series (in the late 2020s) appears visually to align most closely with past development rates.
There will be a lot of work to do to commission all the VRE capacity in the Government Schemes and Actionable Developments scenario. That scenario adds an extra 15+ GW to the Committed and Anticipated level, most of it before 2032.
In the Government Schemes and Actionable Developments scenario we more-than-double existing VRE capacity already built.
Shaping
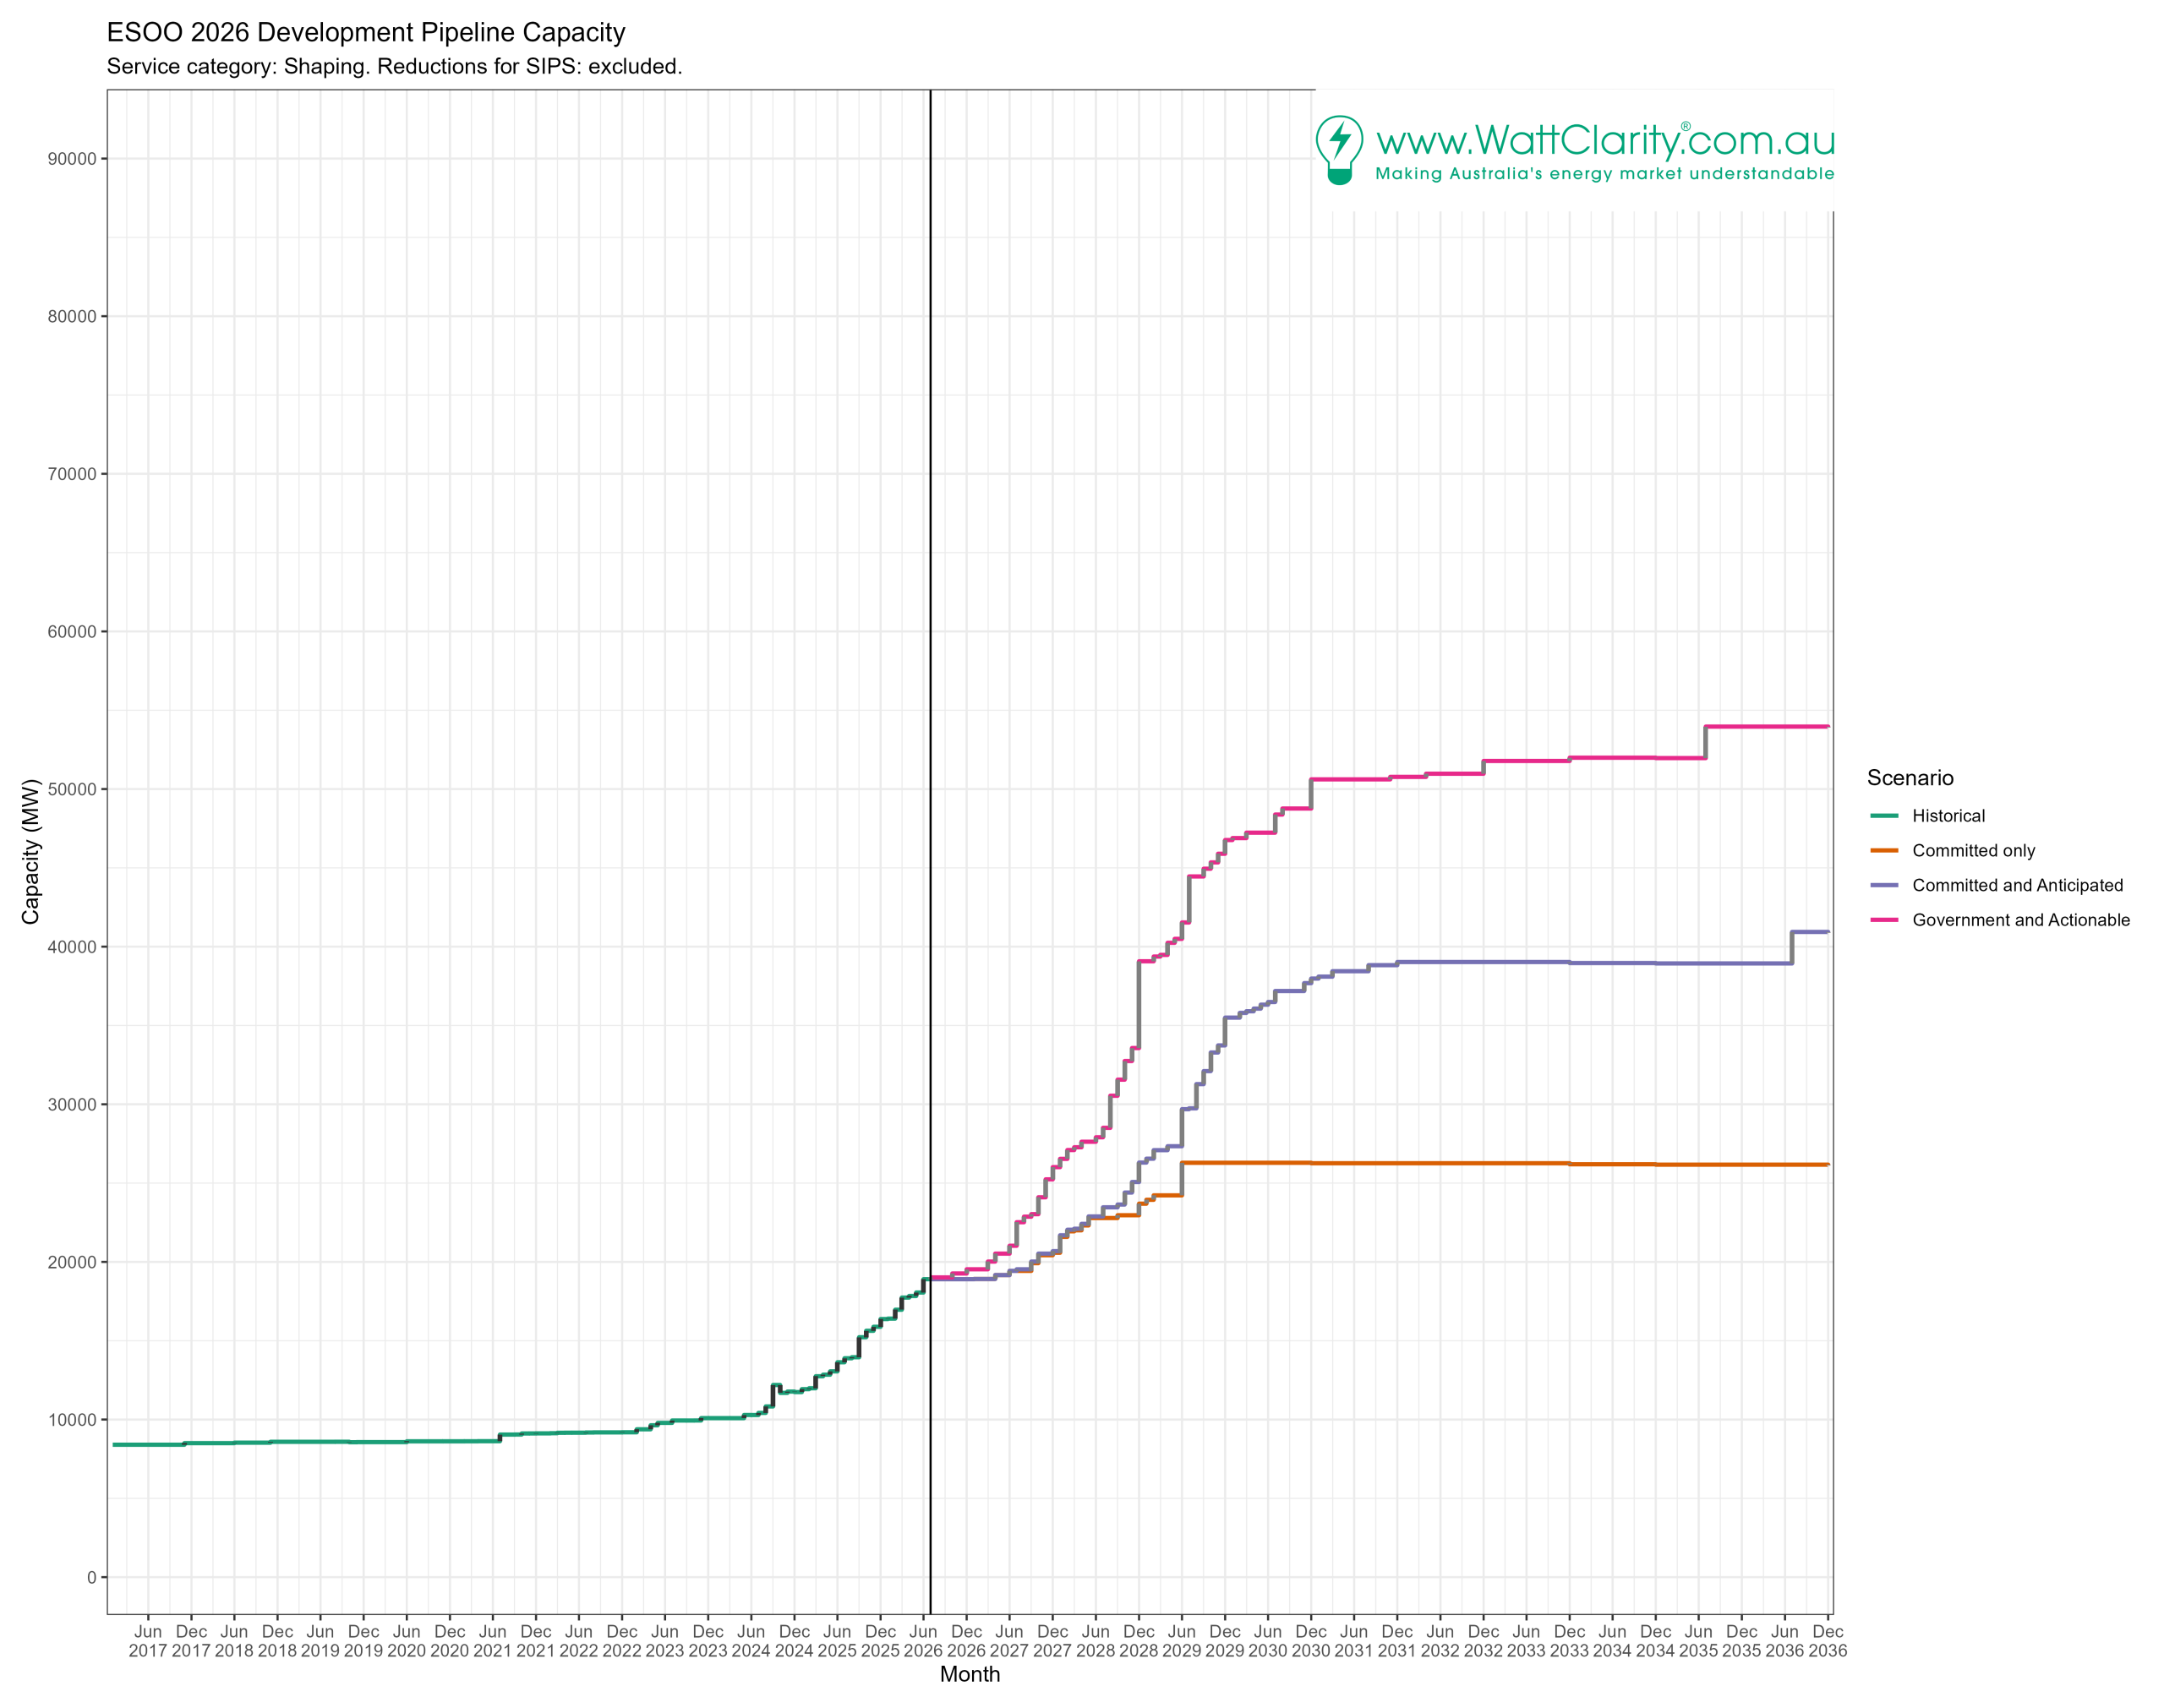
Energy storage systems make up the capacity in this group, most of which are batteries and the others hydro.
The growth trajectories of all scenarios are steep.
In the committed scenario we commission roughly as much new capacity in the next three years as we have built in the last three years. A significant component of that is Snowy 2.0, anticipated to be in the mix by June 2029.
Anticipated projects add a considerable 13 GW on top of the committed total. Borumba makes it into the outlook in 2036. Most other anticipated projects come in after 2028.
By the end of 2036 the Government Schemes and Actionable Developments scenario indicates 53 GW of Shaping capacity could be operational. To contrast that, summing peak the peak demands of each region in the Step Change scenario at 2036-37 suggests we could expect 48 GW if all regions were to peak at the same time.
The biggest step-up comes in December 2028 with timings for Snowy 2.0 brought forward. This is coinciding with other projects including CIS and ARENA-related projects to lift capacity by 5.5 GW in this ambitious development scenario.
Firming
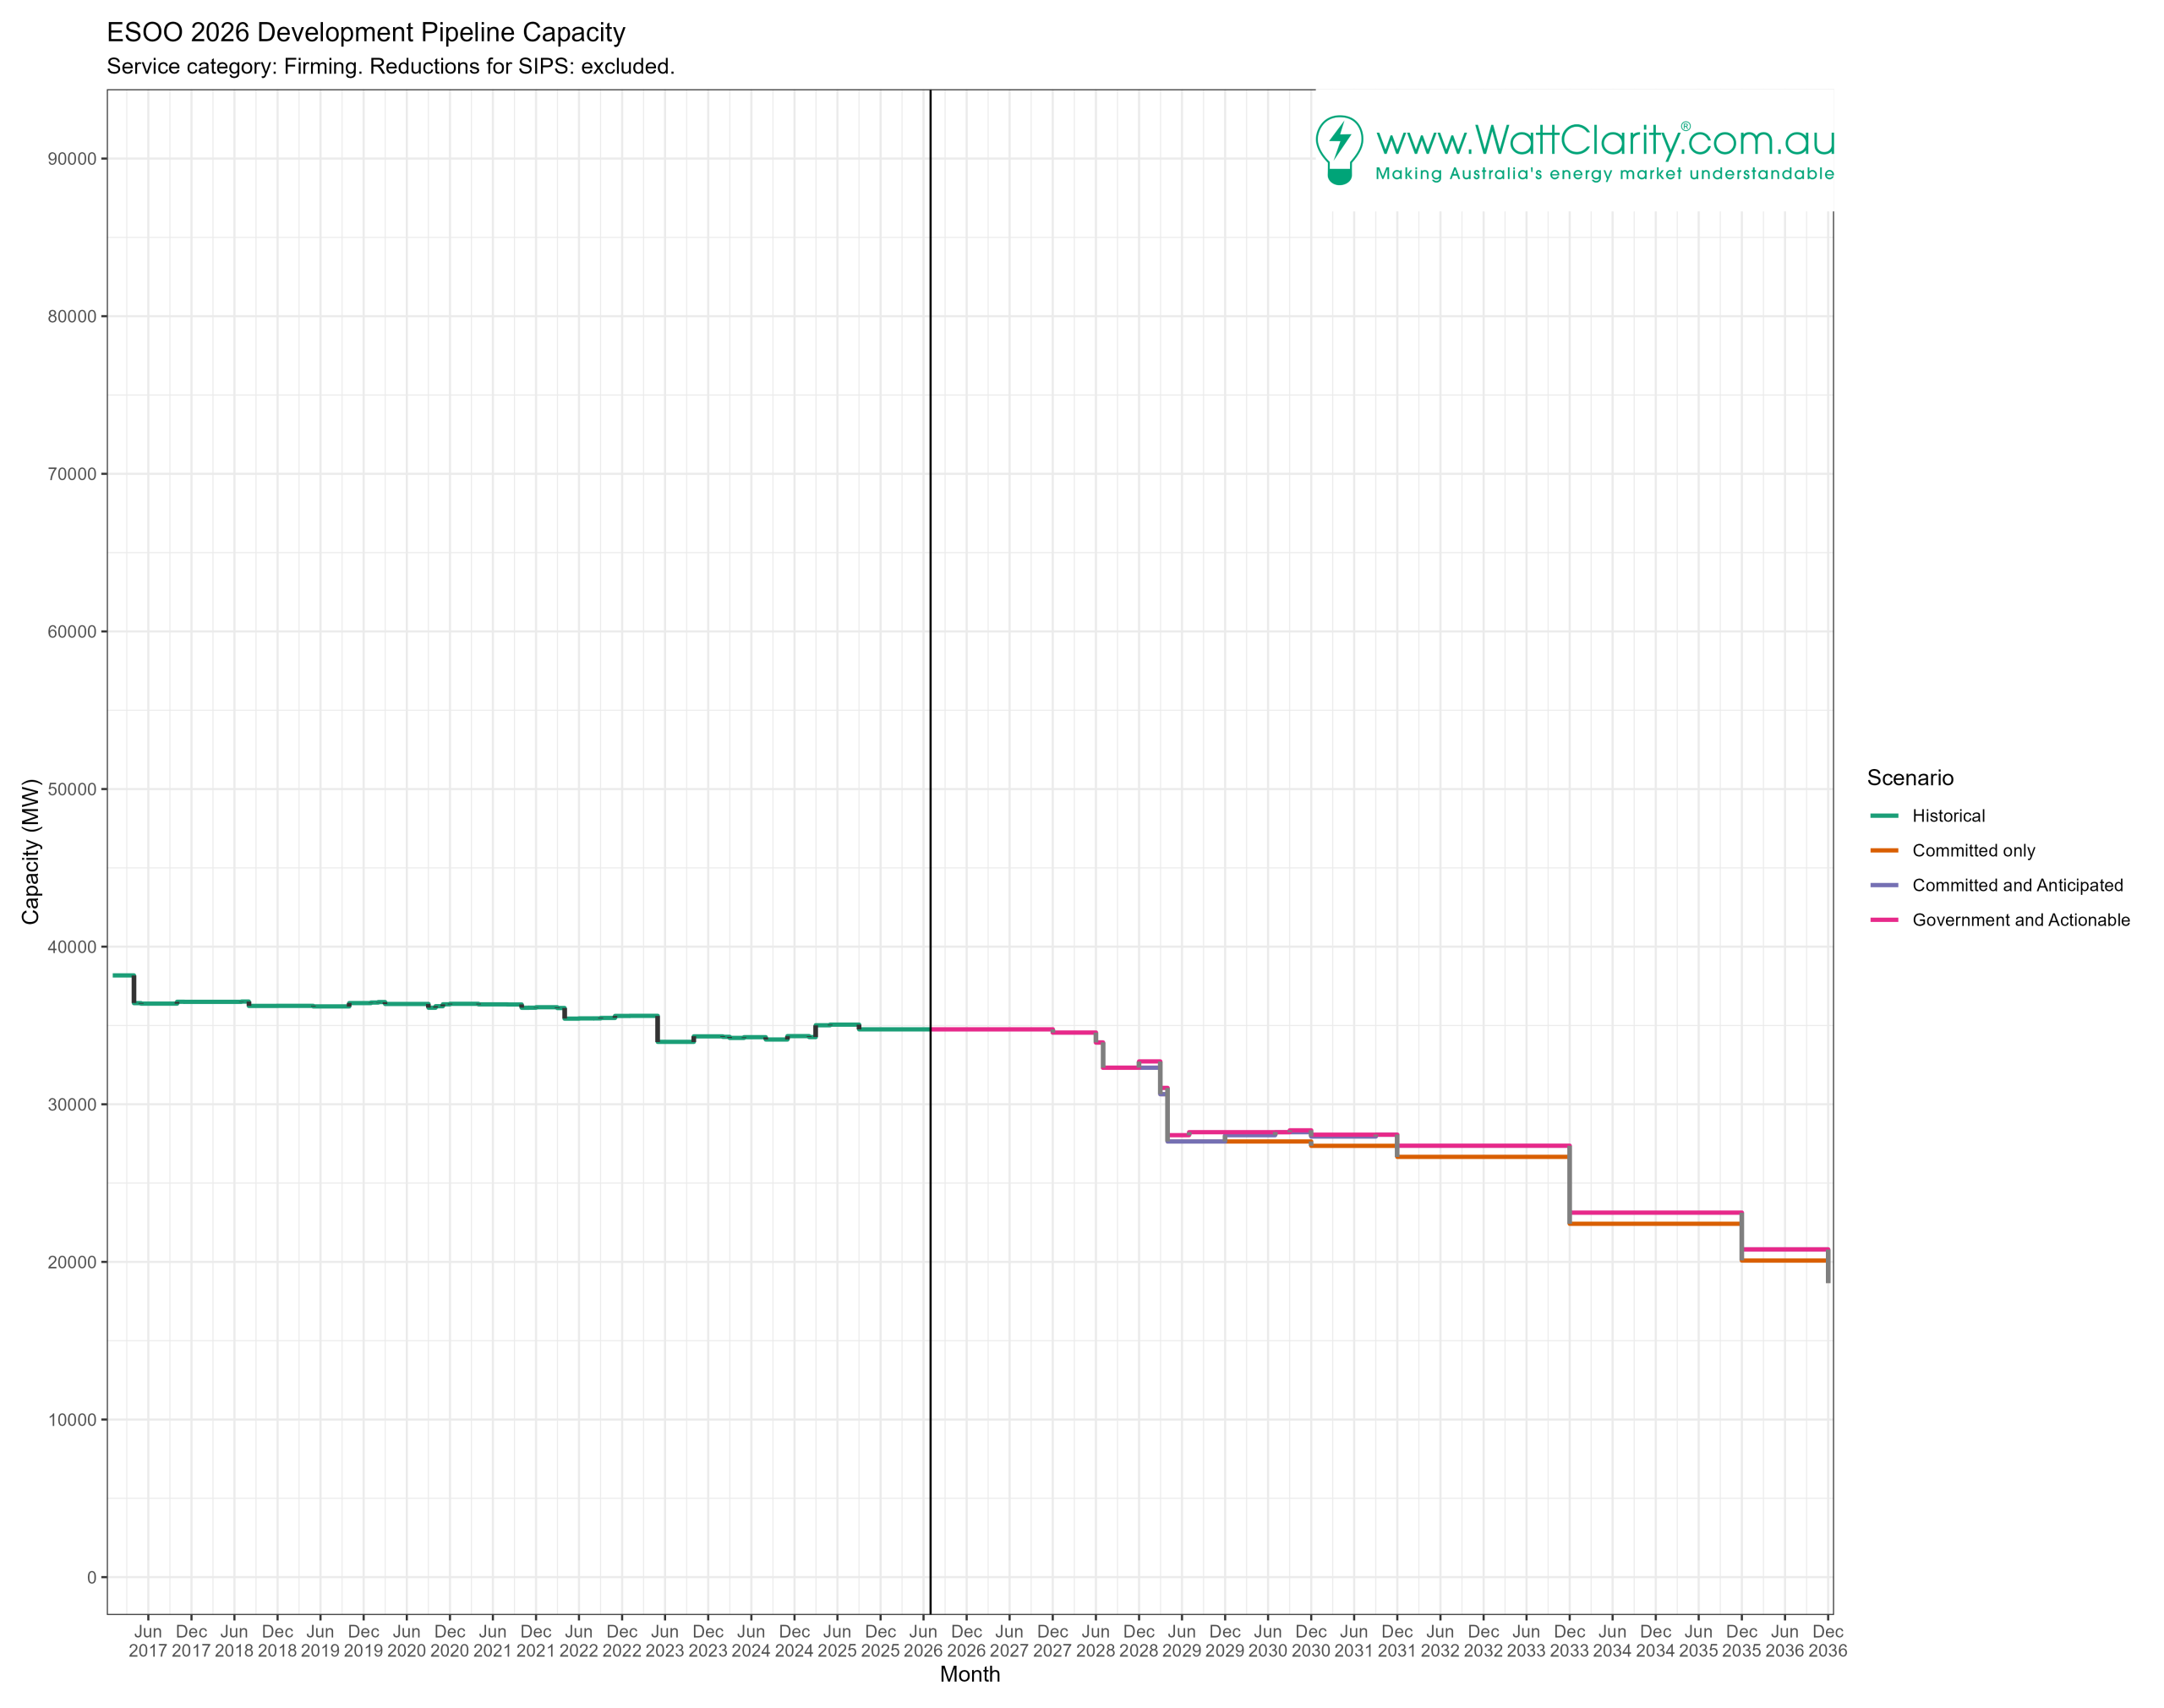
The outlook for firming drops by 15 GW from today’s level.
Coal and gas retirements drive the decline – Osborne, Torrens B (what is not already mothballed), Yallourn, Gladstone, Eraring are the main ones in the near future to 2029.
The step down in December 2033 includes Bayswater and Vales Point. Coincidentally, that’s when some of the greater jumps in unserved energy show up in the ESOO model results.
Two projects are anticipated; Dubbo and Brigalow, adding collectively almost 0.6 GW.
Fully Scheduled Capacity
Adding capacities of Firming and Shaping services we see a relatively rosy outlook for capacity levels if we stick to the plan.
It isn’t uncommon for the NEM to schedule 31 GW of power from scheduled resources. It looks like we will be able to continue to serve that requirement in the future. Capacity of batteries and hydro is covering capacity lost with retiring thermals such that the purple line stays above 60 GW. That is, assuming the anticipated developments do eventuate.
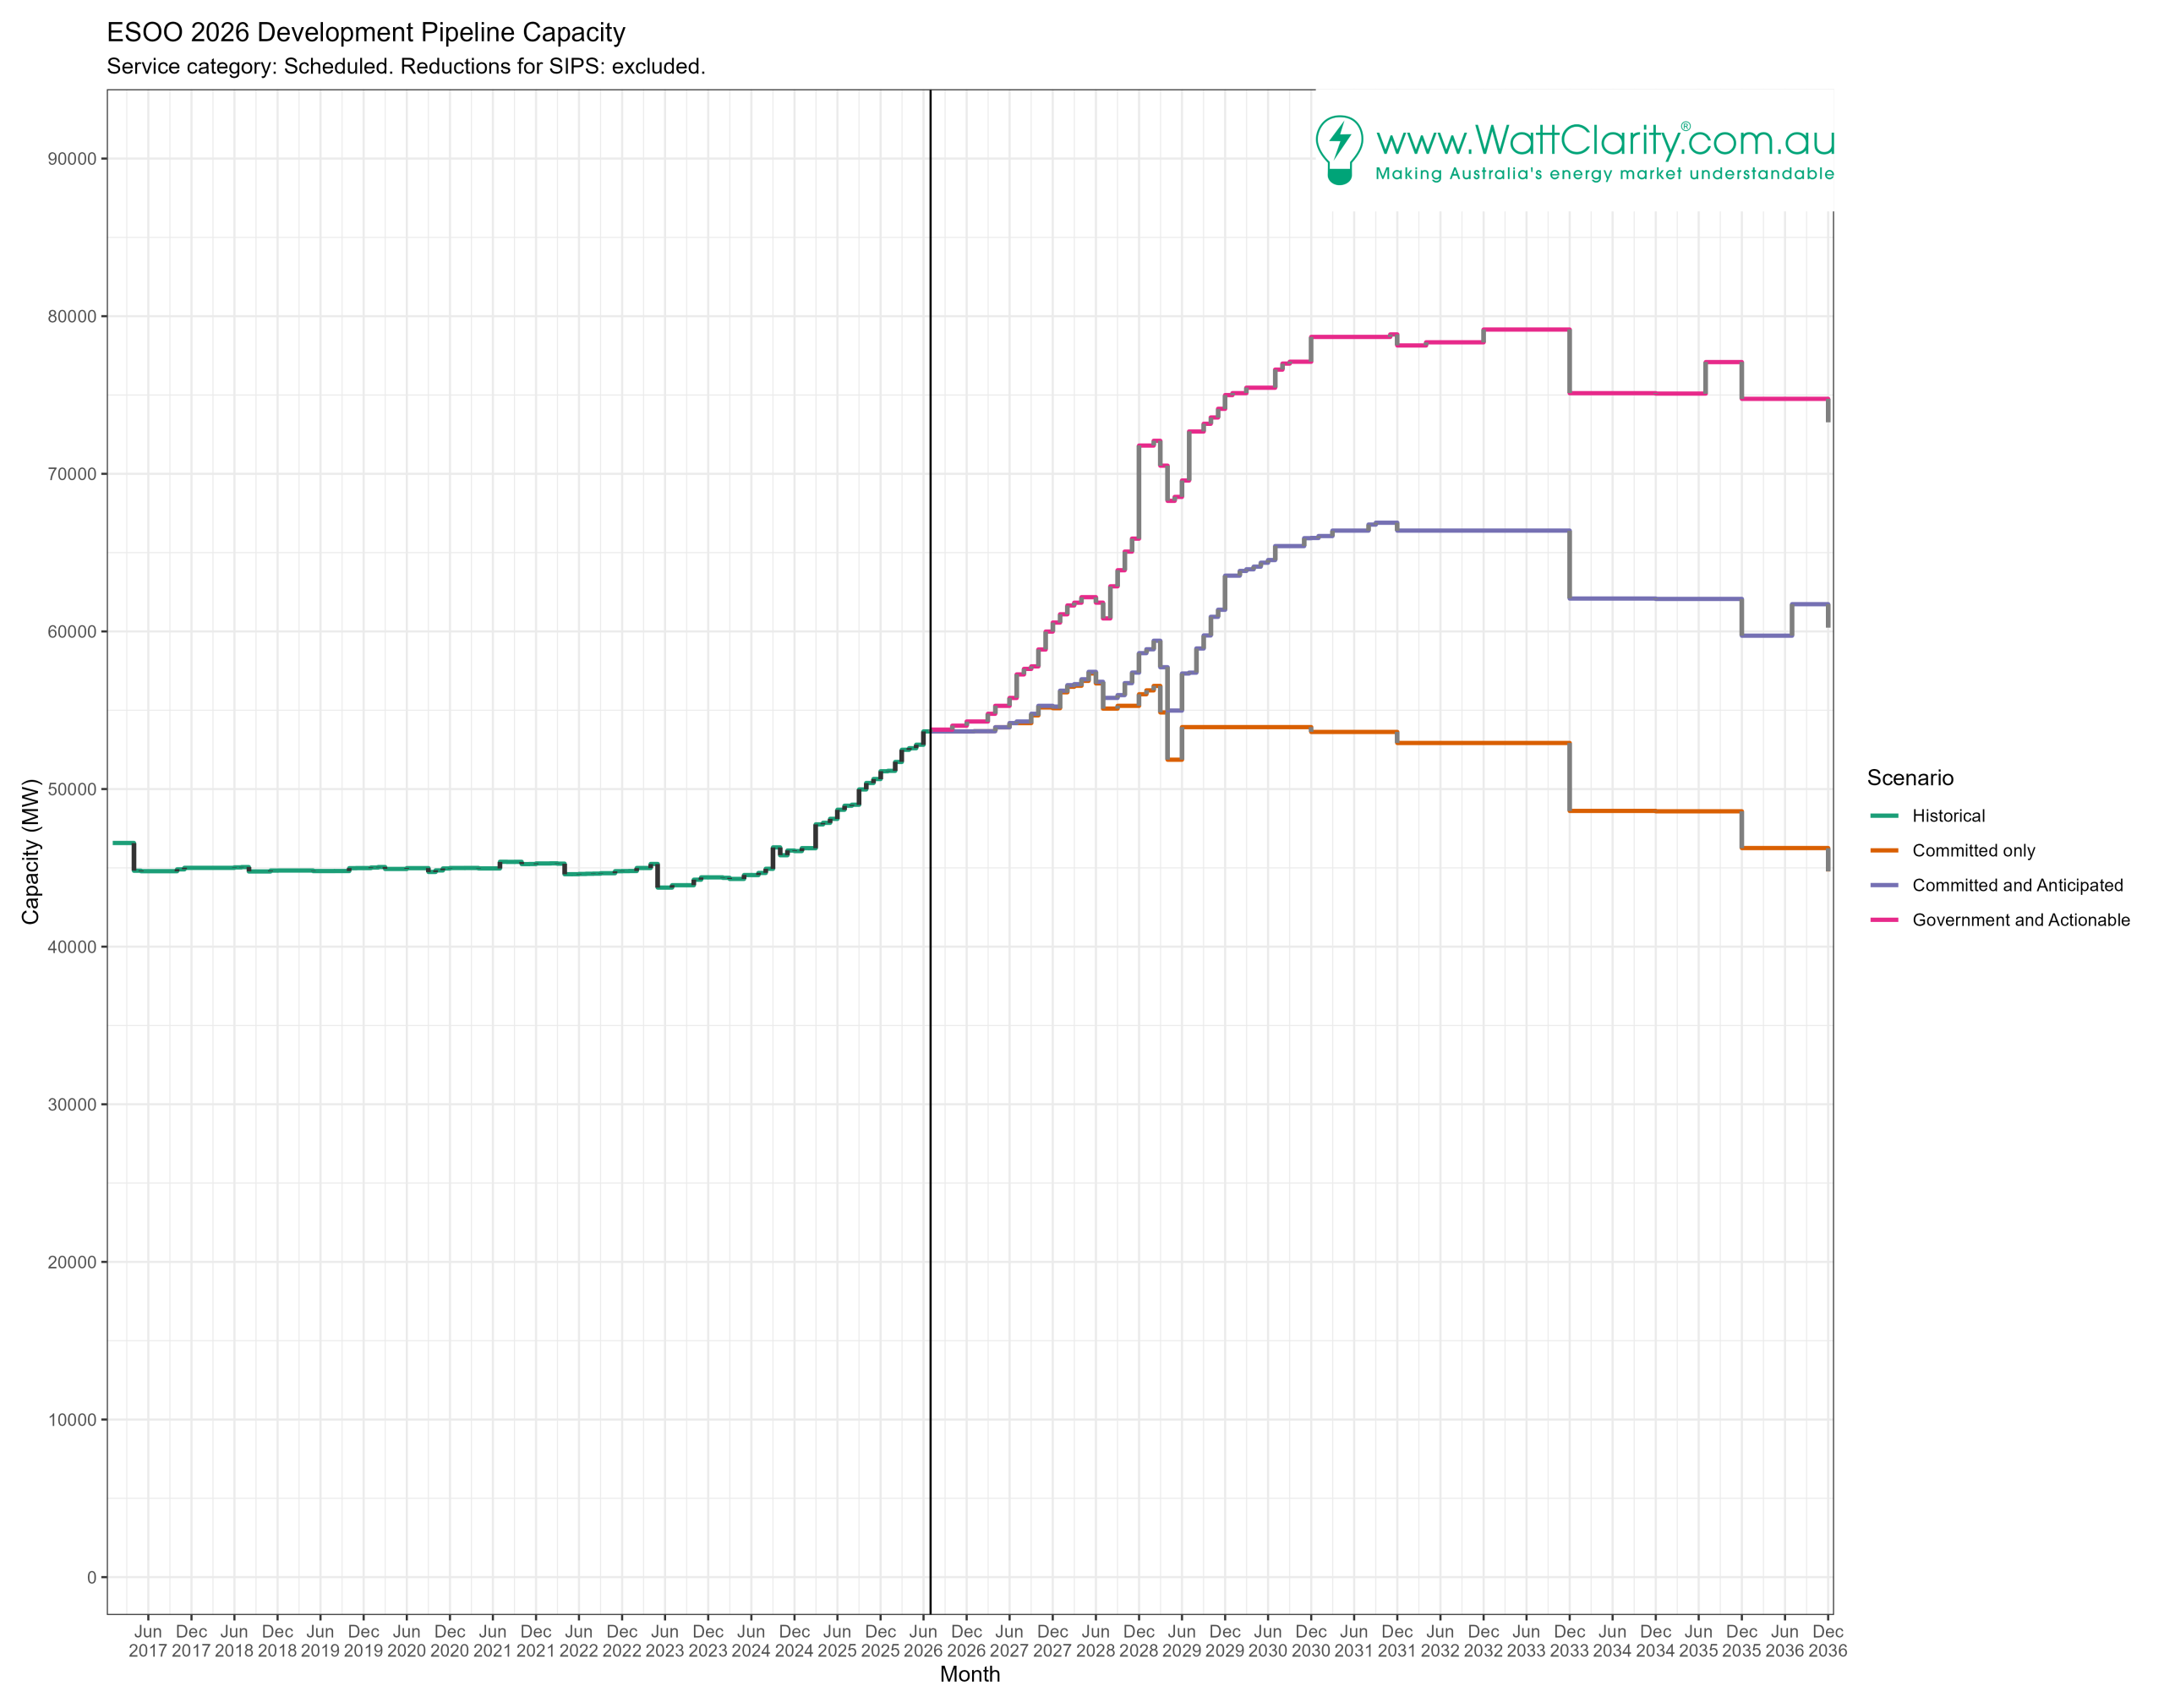
Nevertheless, demand is growing: In the next 10 years forecast peak demand is grows by more than 20% in all regions (50% POE, under the Step Change scenario assumptions). The goalposts are moving.
Considerations
The ESEM aims to facilitate long-term investment in electricity services by addressing the mismatch between new electricity sellers’ needs for long-term project finance and electricity buyers’ preference for short-term contracts.
The projections show there is a huge amount of new capacity to be built in the next 10 years, let alone beyond that.
It’s clear the mechanism needs to be structured to be as effective as possible. And we can have a say:
Last week posted that Energy ministers greenlight ESEM consultation package, with maiden tender targeted for 2027.
The consultation is accepting feedback on the ESEM proposed therein until October 13 2026.

Be the first to comment on "Supply-side capacity in the NEM over the next 10 years (v1)"