The price spiked to 3 x dispatch intervals on Wednesday morning 14th July 2021 to the (higher) Market Price Cap of $15,100/MWh – as noted on Wednesday morning .
Two key points to remember about this price spike:
Key Point #1) The spike only occurred in NSW; and
Key Point #2) The spike was unexpected, as shown in Wednesday’s article.
There were a number of questions asked about ‘what were the causes of this?’ (including by Mike on the article) so I have quickly thrown together this overview of some of the contributing factors using a copy of ez2view version 9.
(A) Interconnectors constrained
Wednesday’s article included a snapshot from NEMwatch at the first price spike (at 08:55) that showed that NSW could not draw on any additional imports from either QLD or VIC. This is commonly talked about as ‘flows being constrained’.
Note that:
1) There were different reasons for the constraints on flows south from QLD (both QNI and DLINK) … and between VIC and NSW (indeed we see that VIC-to-NSW interconnector was constrained such that it needed to flow south at the time).
2) As it turned out, the 08:55 dispatch interval saw flows from QLD to NSW increased to the max, and the forced exports from NSW to VIC drop as low as they were able (not shown here to save space) … but this was still not enough to prevent the price spiking.
(B) Observations using ‘Forecast Convergence’ widget
On Wednesday we saw that the spike was unexpected, by using the ‘Forecast Convergence’ widget in ez2view. Part of the value of this widget is you can quickly flip to another data set and answer the same question (i.e. ‘was this forecast in advance?’).
Here are three other factors:
(B1) Demand in the NSW Region
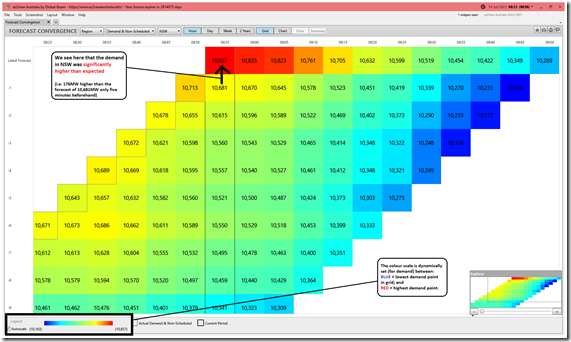
Flipping the data set to look at the ‘Demand and Non-Scheduled Generation’ data set (i.e. a proxy for what AEMO calls ‘Operational Demand’ – or ‘Grid Demand’) we see that the demand was significantly higher than it was forecast to be only 5 minutes beforehand (i.e. by 176MW).
That’s clearly going to have contributed to the unforseen nature of the price spike.
(B2) Available Generation in the NSW Region
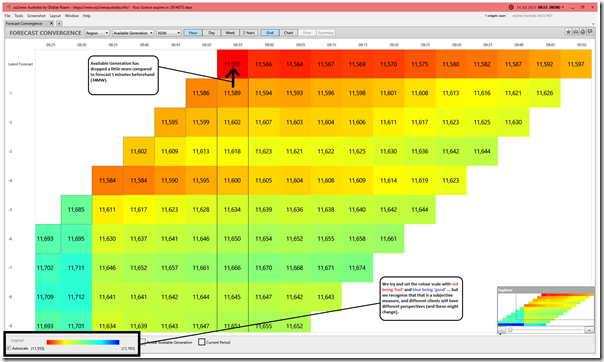
Flipping again to look at ’Available Generation’ for the region (i.e. bid available in the region, but at any price) we see that this also might have had an effect:
This shows an inverse effect (i.e. Available Generation dropping by 34MW) … but this also will have had some share of causation of the unexpected price spike.
(B3) Available Generation from ‘Wind and Solar’ in the NSW Region
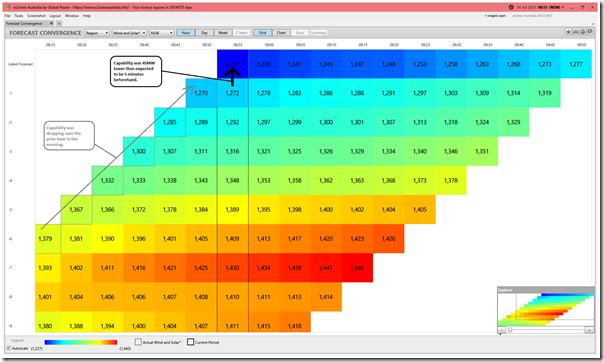
Another option is to look just at Available Generation for Wind and Solar in the NSW region:
With AvailGen dropping 34MW in aggregate, and it dropping 45MW for Wind and Solar, that means it must have gone up 11MW for fully Scheduled units.
… so in net terms there was >200MW deficit on Available Supply vs Demand in NSW (combining drop in AvailGen and increase in demand) compared to what was forecast 5 minutes beforehand.
(C) Dispatch outcomes in the 08:55 dispatch interval
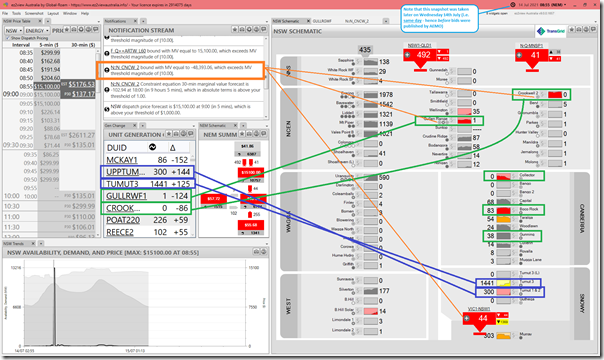
Next we use a couple widgets in the following snapshot to highlight some of the other changes for the 08:55 dispatch interval:
I’ve annotated three of the widgets to show a couple related things taking effect:
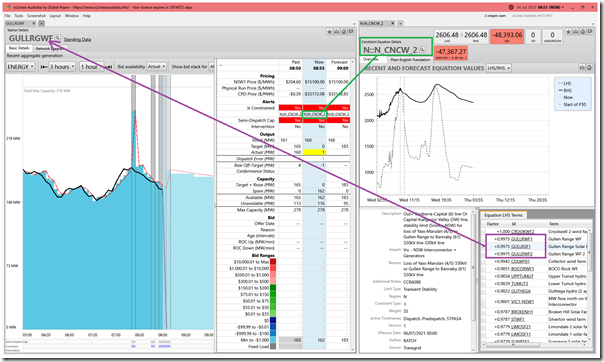
1) We see a number of wind farms (notably GULLRWF1 and GULLRWF2, and also CROOKWF2 – but also others) dropping output sharply over 5 minutes. Collectively this represents a significant loss of supply of greater than 200MW collectively.
2) At the same time, we see a significant increase in generation at TUMUT3 and UPPTUMUT. In rough terms, the net effect is about even in terms of raw MW numbers (we’ll get to pricing below!).
3) We see that the constraint equation ‘N::N_CNCW_2’ is bound with a high Marginal Value (i.e. which represents a cost to NEMDE, in absolute terms – hence is an indication of significance).
Remember that (from v7.4.5.665 on 29th July 2020) the three widgets highlighted use ‘Final MW’ (i.e. end-of-interval SCADA values for output) when ez2view is Time-Travelled. This makes it easier to line up changes in output with other factors (like demand and price) published by AEMO on an ‘end of interval’ basis.
Let’s look specifically at the GULLRGWF Station ID … encompassing both GULLRWF1 and GULLRWF2 (and also GULLRSF1 … though that had lesser effect):
The ‘N::N_CNCW_2’ constraint equation related to:
… an outage on either the “Canberra-Capital (6) line” or the “Capital-Kangaroo Valley (3W) line” … and imposed a “stability limit for loss of Yass-Marulan (4/5) or Gullen Range to Bannaby (61) 330kV line 330kV line”.
We see that the unit most affected (i.e. highest LHS factor) was Crookwell 2 Wind Farm – but then came the 3 x units at Gullen Range (whose aggregate output is shown in the chart on the right. Despite bidding down at –$1,000/MWh at the RRN, these units were ‘constrained off’ completely because of that constraint!
1) Hence we can understand the reason why those wind and solar units reduced output sharply (i.e. not because they wanted to – but because they were told do, via the constraint equation).
2) Note that this particular constraint was visible on the day … which was a better situation than was the case on 13th October 2020 in QLD for instance.
(D) Touching briefly on bids
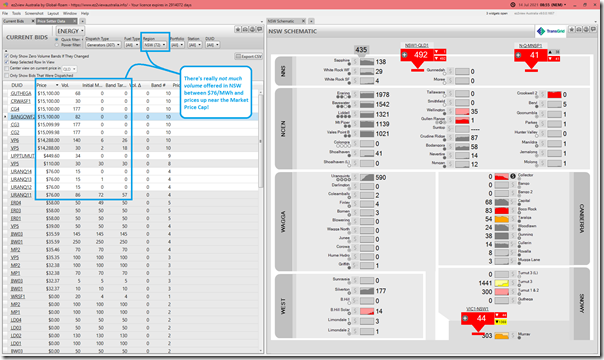
Here’s another view of that same ‘NSW Schematic’ but viewed the next day (i.e. after bids had been published by AEMO on a ‘next day public’ basis). These bids are also shown next door in the ‘Current Bids’ widget … sorted on an ascending order basis:
There’s an rebid shown in the Schematic for Collector WF – but there was actually no meaningful change made (just another of those increasingly noisy automated rebids made on a continuous basis – a broader change in the NEM that we’re delving into in more detail for GenInsights21).
What’s more important is the shortage of much meaningful capacity offered into the NSW region above $58/MWh bid at the RRN for Eraring and prices up near the Market Price Cap. Not much capacity at all … which is one of the reasons why the jump in prices was so significant up to the market price cap.
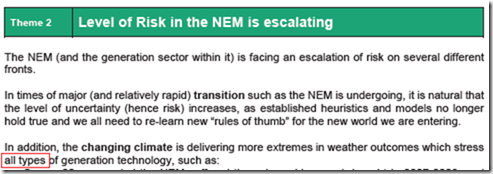
This is another reminder of how we said ‘The Level of Risk in the NEM is escalating’ when we published the Generator Report Card 2018:
This was discussed in Theme 2 within Part 2 of the 180-page analytical component within the GRC2018 …. and which we’ve been updating for the most recent 30 months in GenInsights21.


Another dip for the NSW southern highlands wind farms at 19:00 this evening. 500 MW in total. Is Transgrid testing SmartWires as part of the VNI upgrade? Has it something to do with the commissioning of Stockdill BSP?