One month ago (on Sunday 23rd August) we saw Scheduled Demand fall to a low-point of 3,889MW at 13:15 on a sunny day across much of Queensland. I noted then that this was the lowest point seen for demand in over 16 years, with the previous low point being
In a (disconcerting*) game of ‘race to the bottom’ we see that that low-point from only a month ago has been bettered today, Sunday 27th September 2020.
* it’s disconcerting, given the accelerating and unresolved challenges confronting the grid with the cannibalisation of ‘keeping the lights on’ services by the growth of ‘anytime/anywhere’ energy.
1) At least now, compared to when we wrote the GRC2018, the challenges are at least starting to be acknowledged more broadly.
2) These challenges are solvable, but not easy to solve (and certainly not if they are not acknowledged).
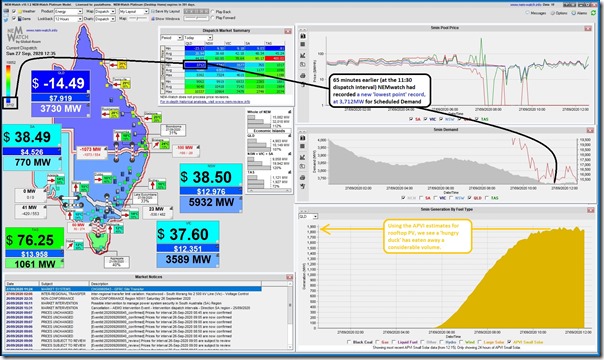
Here’s a snapshot from our NEMwatch v10 entry-level dashboard highlighting the 12:35 dispatch interval, with the Scheduled Demand** being down at 3,730MW for that dispatch interval:
As per the annotation on the image, the lowest point for Scheduled Demand** during this day occurred at 11:30 – down at 3,712MW.
** remember that AEMO increasingly talks about ‘Operational Demand’ (better reflects consumption from the grid – so some talk about it as ‘Grid Demand’) whereas the measure above is ‘Scheduled Demand’ (some see it provides a better gauge of why prices are what they are – so some talk about it as ‘Market Demand’). See here to review the gory details of all the different challenges in measuring demand.
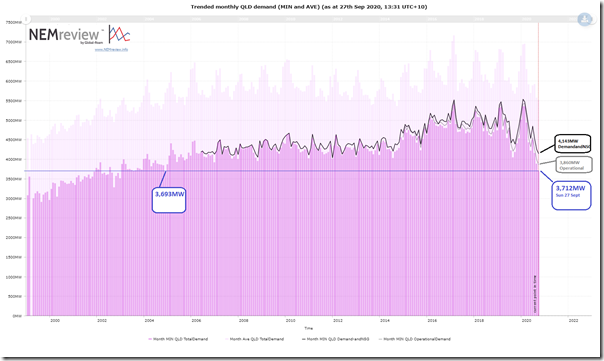
Using this longer-range query from NEMreview v7, we can quickly see that the low point today is lower than last month, and approaching the low point from November 2004 (3,693MW at 06:45 on 21st Nov 2004 – which looks to be after loss of a potline or some other disruption?):
This chart also shows the monthly minimum point for AEMO’s half-hourly numbers for Operational Demand (3,860MW for today’s low point) , but with ‘like-for-like’ history only available back to the end of 2014 it’s harder to make a longer-range comparison.
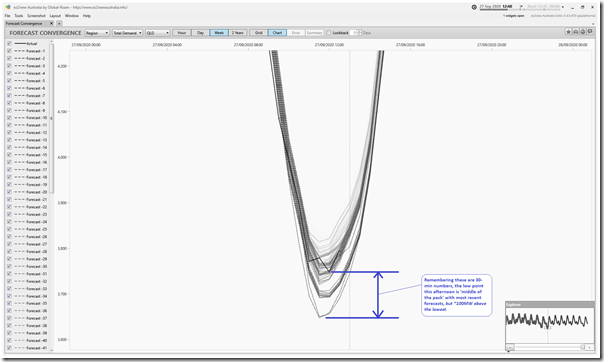
I’ve included this snapshot from ‘Forecast Convergence’ widget in ez2view as I was curious to see how this low point tracked against the preceding AEMO forecasts in ST PASA and P30 predispatch:
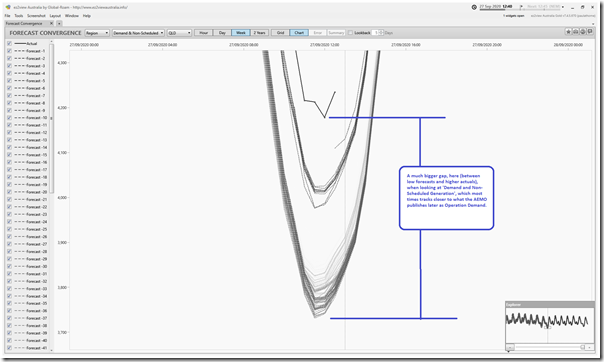
Flipping to look at how AEMO’s forecasts for ‘Demand and Non-Scheduled Generation’ converged on reality, we see there is a much greater gap from low forecasts to actual. No time to explore on this one now…
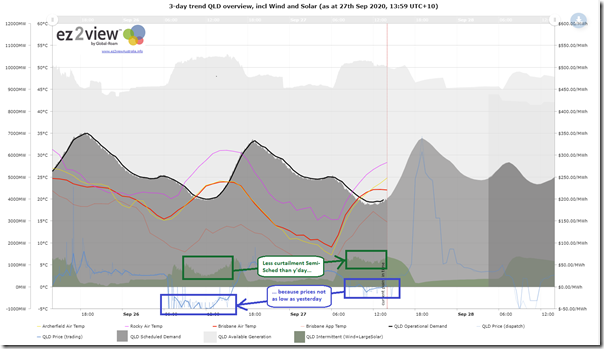
Finally, with this focused trend view via ez2view online, it’s interesting to note that there was less price-based curtailment of Semi-Scheduled generation in the QLD region today compared to yesterday, as mostly dispatch prices through the ‘solar peak’ times were at $0/MWh or just below (meaning positive revenue for Semi-Scheduled generators, after factoring in their LGCs):
More pain to come as more, as ‘anytime/anywhere’ energy squeezed into an overflowing grid that still requires a share of ‘keeping the lights on’ services …


Paul, is the discrepancy in the second last image perhaps a result of Wivenhoe pumping demand and it being reflected differently in the different values AEMO publishes? I say this because I have noticed before that the impact of this load does not show up in the demand values shown in the popular ‘Pocket NEM’ app, but does if viewing the AEMO NEM web dashboard (ie. the AEMO dashboard demand can often by ~250MW higher than the values in Pocket NEM’. My guess being that Pocket NEM uses a different data set for demand than AEMO’s dashboard does, which them each treating the Wivenhoe load separately.
Interesting to see at dinnertime with solar off duty the wind was down to about 5% of the power supply in the NEM and less in WA. Surely sustainability of RE depends on the minimum level of supply, rather than the installed capacity, the high points or the average! Does that mean that until the whole of the demand can be satisfied by RE at the lowest level of sun and wind supply we will have to maintain 100% conventional power capacity?
Until the rules are corrected there are going to be problems with the balance in the NEM. The delay to the 5 minute rule and the lack of additional rules to reflect the valuable services that batteries can provide has compounded this problem. If these were in place we would be seeing the installation of GWh scale batteries on the NEM.
As a result we have coal fired units operating in QLD and Victoria, which otherwise would be shut down for weeks at a time during these periods of low grid demand as they would be uneconomic. Of course put a price on the pollution the fossil fuel power plants produce and the transition would be even faster.
Demand management of easy high load items like hot water services would make a difference to the balance of the supply and demand, but HWS are boring so nothing has happened.
I was under the impression that Queensland distributors use ripple control to switch in hot water during such low demand periods. Another low-hanging fruit for demand management would be eutectic storage elements in commercial refrigeration (office towers, shopping centres and the like).
At least this Sunday the QLD – NSW connection was able to operate at close to maximum capacity. Other weekends we have seen up to 800MW of RE being curtailed.
If the QLD Government was serious about green house gas reductions, then they would shut down one of their coal fired units during these months of low demand. Doesn’t make a great press conference, so it doesn’t happen. Might up set their union mates as well.
The QNI Interconnector is undergoing a minor upgrade that will continue through to the end of 2021 (according to recent TransGrid tweet). To facilitate the work, the 88 Liddell to Muswellbrook 330 kV Line has been taken out-of-service on a daily (Mon to Sat) and more recently, a 5/6 days continuous basis. This outage results in a lowering of the Qld to NSW export capability by 700-800 MW. These outages for upgrade work and the loss of export capability from Qld (and increase in RE curtailment) is giving us a glimpse into the future with the unstoppable increase in Variable Renewable Energy Sources in Qld. So much generation with no where to go!!
A couple of questions Craig, given that the sun is gone by dinnertime, certainly in winter, what keeps the lights on when the wind is low? Last night the wind contribution was down to 10% of demand across the NEM. Currently the wind supply is down to 5% of total demand across the NEM, zero in Victoria, 1% in NSW and Queensland and 3% in WA.
Second, how many batteries do you envisage to provide for these gaps in wind supply, given that the original big battery at Hornsdale would have lasted the SA grid for five to ten minutes, It is bigger now so it might stretch to 10-15 minutes.
Basing the amount of wind output at 12:30pm during these months of low demand is going to be very misleading as many wind farms could be curtailed due to the low demand and high solar output.
When you look at the levels of wind output when solar has dropped away, it is much higher. Then you need to scale the wind output based on the projected ratios of roughly 50:50 wind and solar. At the moment States like QLD have very little wind installed. There is a 1,000MW wind farm under construction plus a 800MW wind farm likely to proceed. This is will start to balance out the QLD grid.
In terms of storage there is going to be a dramatic increase in battery storage going in over the next 10 years. Based on Tesla’s projections the cost of cells should drop by 50% over the next five years, while production volumes grow dramatically. Already there is a 6,000MWh and 1,400MWh battery under construction in California. In time we will see similar and larger ones built in Australia.
Batteries are relatively quick to deploy and the costs are falling quickly, so the installed capacity will grow very quickly after 2025 and more so again after 2030.
Then of course there is hydro, pumped hydro and as the grid approaches 90% RE there will be other deep storage such as flow batteries, green hydrogen and compressed air.
The biggest problem largely being ignored by the wind and solar advocates is that rooftop solar is detrimental to both the physics of the grid and the economics of large-scale generators. This article highlights one symptom.
The second biggest problem is CfD that reverses the market signal ie lower wholesale is more costly for CfD purchasers, and makes further investment unattractive without a CfD.
After that we have the requirement for additional equipment and services to incentivise (make more costly) the inertia and system strength services that wind and solar cannot provide.
Then we have the additional network infrastructure required to connect new small distributed generation at low utilisation rates.
Also the reducing capacity factor of the entire system which can only increase costs.
Our electricity system is in dire straits – there are ways out of the mess, but who’s listening?
Craig, check out how pumped hydro is going in North Queensland.
https://petercampiononline.wordpress.com/2020/09/28/genex-kidston-pumped-hydro/
Can you find some sustainable pumped hydro schemes around the world? Just a polite question, I am researching the topic:)
I am wondering how useful a droop characteristic would be for solar inverters, as well as home batteries and loads such as (future) electric vehicle charging in these situations (in particular, commercial systems with “zero export” constraints)? Would it reduce the need for inertia from synchronized generation?
It is possible to program inverters to be grid forming (contributing to fault level and system strength), and grid-scale batteries can even offer black start capability e.g. https://www.powermag.com/benefits-of-battery-storage-based-black-start-capability/
A quick search of IEEE finds quite a few papers on control strategies for use in low-voltage connected inverters, which aim to improve rotor angle stability of synchronous machines and transient stability generally.