For NEM watchers, it has been hard to choose which aspect of the 31 January transmission line destruction / NEM islanding event to look into next. In the immediate aftermath, Paul’s overview article summarised “13 headline questions” arising from the event, all of which would bear further analysis – I think Paul undersold himself there, I got to well over 20 questions before losing count.
Tucked away towards the end of his piece was a section which merits re-reading, just in case the heading “Exacerbated co-optimisation challenges” caused your eyes to glaze over. Paul noted that prices for market Frequency Control Ancillary Services (FCAS) in South Australia had leapt in the wake of the islanding:
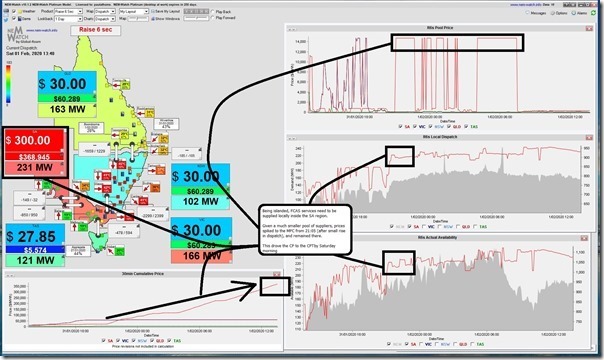
and wrote:
Particularly with respect to South Australia:
1) Participants who are registered to be providing FCAS services will be especially mindful of the market power that they have for provision of FCAS services in the absence of interstate competition.
2) However it does not end there, as generators will be increasingly looking at the costs they are incurring for the FCAS services the grid is requiring.
(a) These costs are important everywhere (and for some participants much higher than you’d ordinarily think) which is why we included a monthly break-down of these costs through CAL 2019 in the GSD2019.
(b) In South Australia in particular this will be worth watching closely in the next few weeks, with some generators conscious of the choice that confronts them (turn off to save on FCAS recovery charges, or continue running to provide the energy the grid needs).
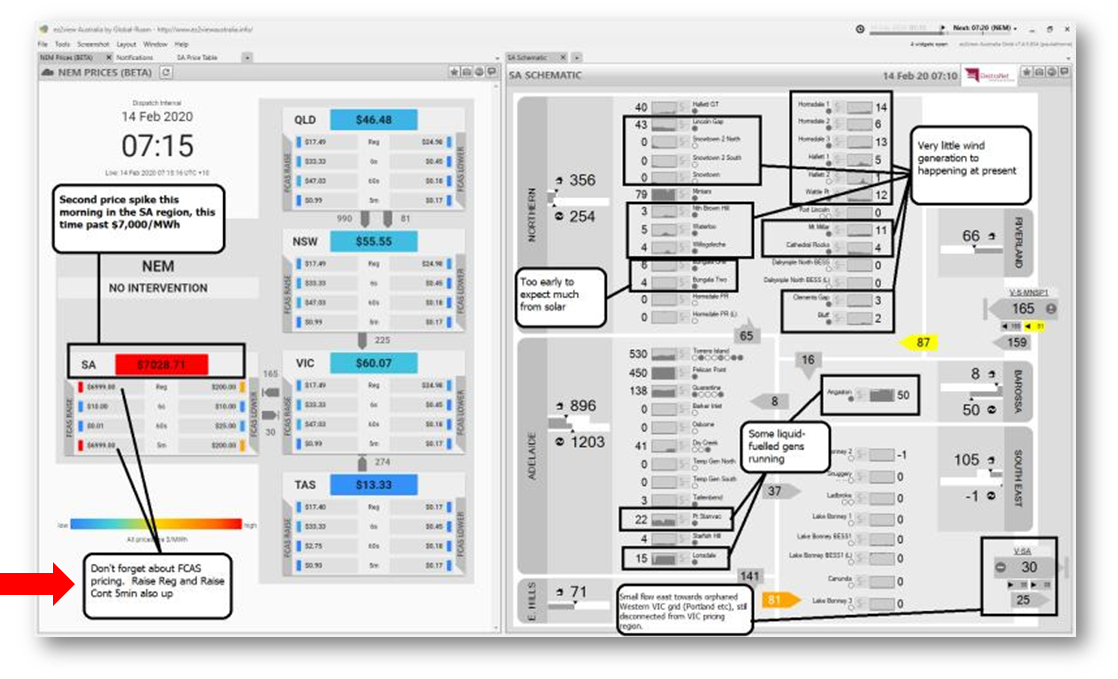
Paul again noted high South Australian FCAS prices in a short LinkedIn post just a few days ago:
So what’s this all about?
FCAS – A Quick Recap
Despite Paul and a few others helpfully reminding us that it’s not the whole story, almost all discussion of wholesale electricity prices focuses on just one of the nine distinct prices set in the NEM every five minutes – the “energy’ price which determines payments from customers to generators for the basic traded product. But in addition to the continuous production and pricing of energy, running a large scale grid requires supply of technical capabilities needed to maintain its physical stability and security – so called Ancillary Services.
In the NEM, the other eight prices that we talk about less often are for a subset of Ancillary Services supporting frequency control – keeping supply and demand in close real-time balance, reflected in system frequency staying within a narrow band around 50 Hz and returning quickly to that band if a disturbance shifts it. Like energy, these services are dispatched and priced every five minutes and are collectively called FCAS. Without going into any technical detail, they provide AEMO with mechanisms enabling controlled changes in generation or load within various timeframes much shorter than the energy market’s five minute cadence. For a great introduction to FCAS, read Jonathan Dyson’s post here on WattClarity, and for examples of FCAS services in action, a couple of my articles here and here.
Historically, FCAS capabilities have been provided mostly by generators as by-products of their main game, energy production, although batteries and certain loads with appropriate controls can also provide some or all forms of FCAS. In an analogous way to energy prices, market FCAS prices are set via bidding and clearing processes, which are fully enmeshed – coöptimised – with the NEM’s dispatch process for energy.
The quantities of FCAS services required are much smaller than the volumes of energy traded through the NEM (like energy, these volumes are measured in MW and MWh). For most of the NEM’s history, prices for FCAS have also tended to be much lower than the energy price because of their “by-product” nature. With lower volumes and lower prices, the overall cost of FCAS has typically been only a few percent of the value of energy dispatched through the NEM. Hence all the focus on the energy price.
But under unusual conditions – and conditions in South Australia since the 31 January event certainly fall into that category – FCAS prices can spike to extreme levels, right up to the same market price cap applying to energy – $14,700/MWh.
Let’s look at how FCAS prices have behaved since the islanding event and what this has meant for wholesale revenues and costs in South Australia.
FCAS Prices in South Australia
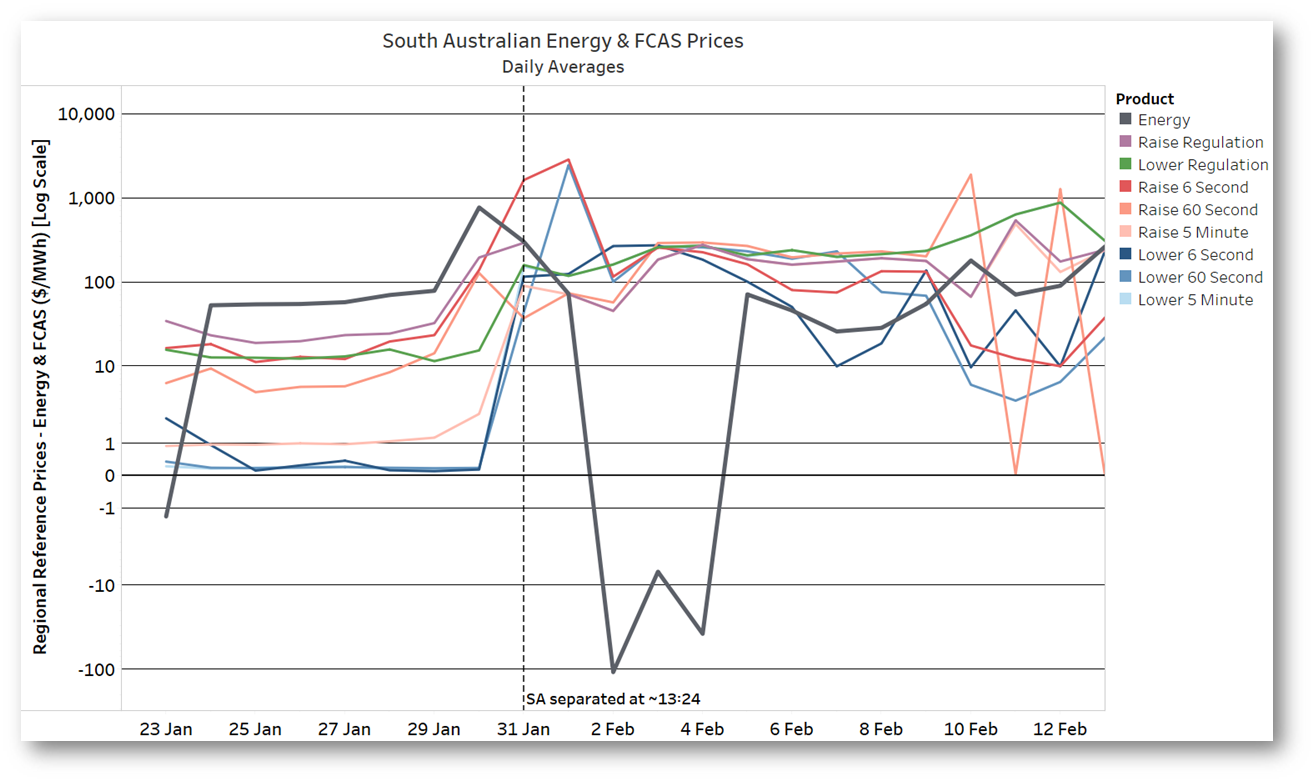
Here are daily average prices for energy and the eight FCAS products in South Australia over the week leading up to 31 Jan and for the couple of weeks afterwards. Note the log scale used on this graph to better pick out the very wide range of price outcomes:
The striking feature here is that the relationship between energy and FCAS prices was turned on its head by the separation event. That’s largely because under normal conditions, FCAS can often be supplied from anywhere in the NEM, so the cheapest offers from generators, batteries, or loads in any region can be used to meet AEMO’s requirements. Not all generators are able or choose to supply FCAS (until recently none of the NEM’s large scale renewable generators did so – however that is changing, and this post may show why that’s long overdue). But with a NEM-wide pool of potential suppliers, FCAS prices have tended to be lower – often much much lower – than energy prices.
But when South Australia became islanded by the transmission line collapse, FCAS requirements for that region could only be supplied from local providers – and there is only a small subset of participants in South Australia who have chosen to offer in the FCAS markets. With a suddenly reduced group of providers, the price of all FCAS products in South Australia leapt from a pre-event range between few cents and roughly $30/MWh (some higher levels on 30 Jan, driven by the very high energy price averaging over $770/MWh on that day), rising to daily average levels mostly over $100/MWh and in a few cases approaching $3,000/MWh after the separation event – remember, these numbers are daily averages!
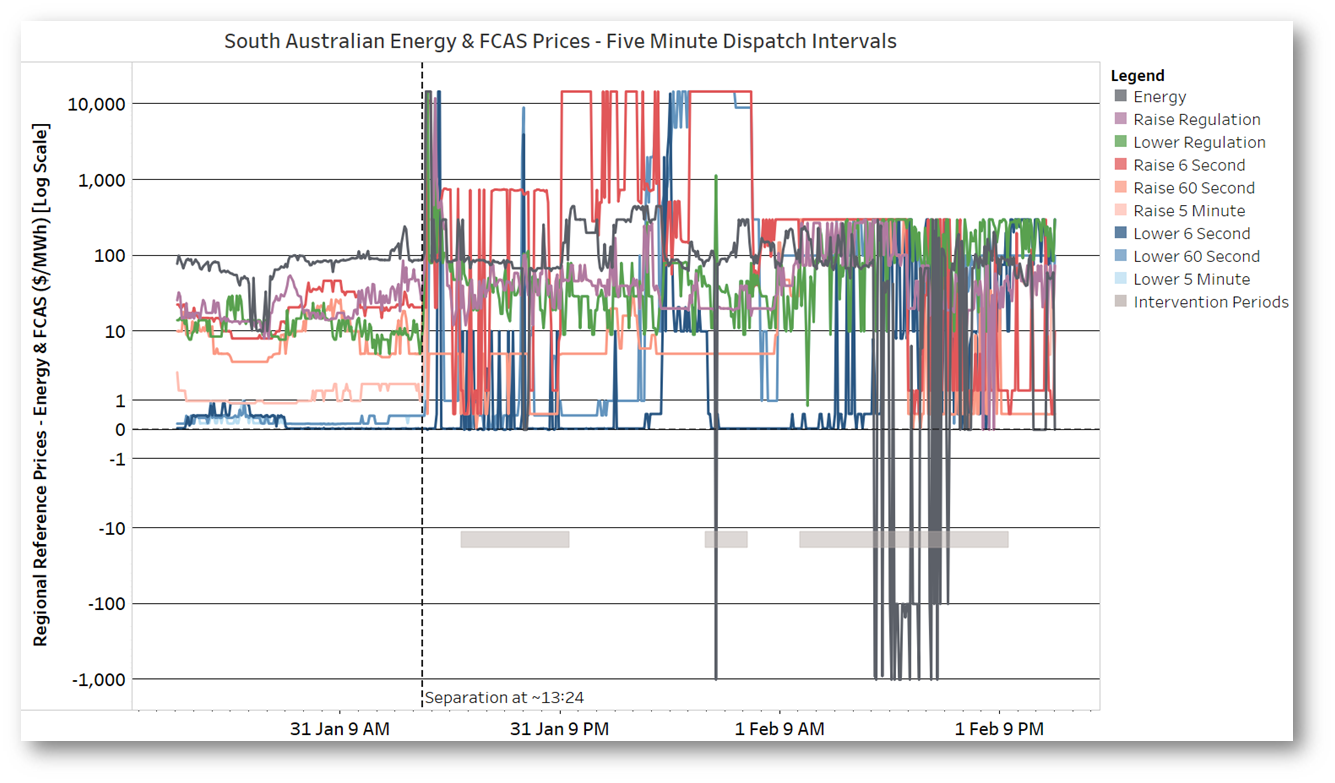
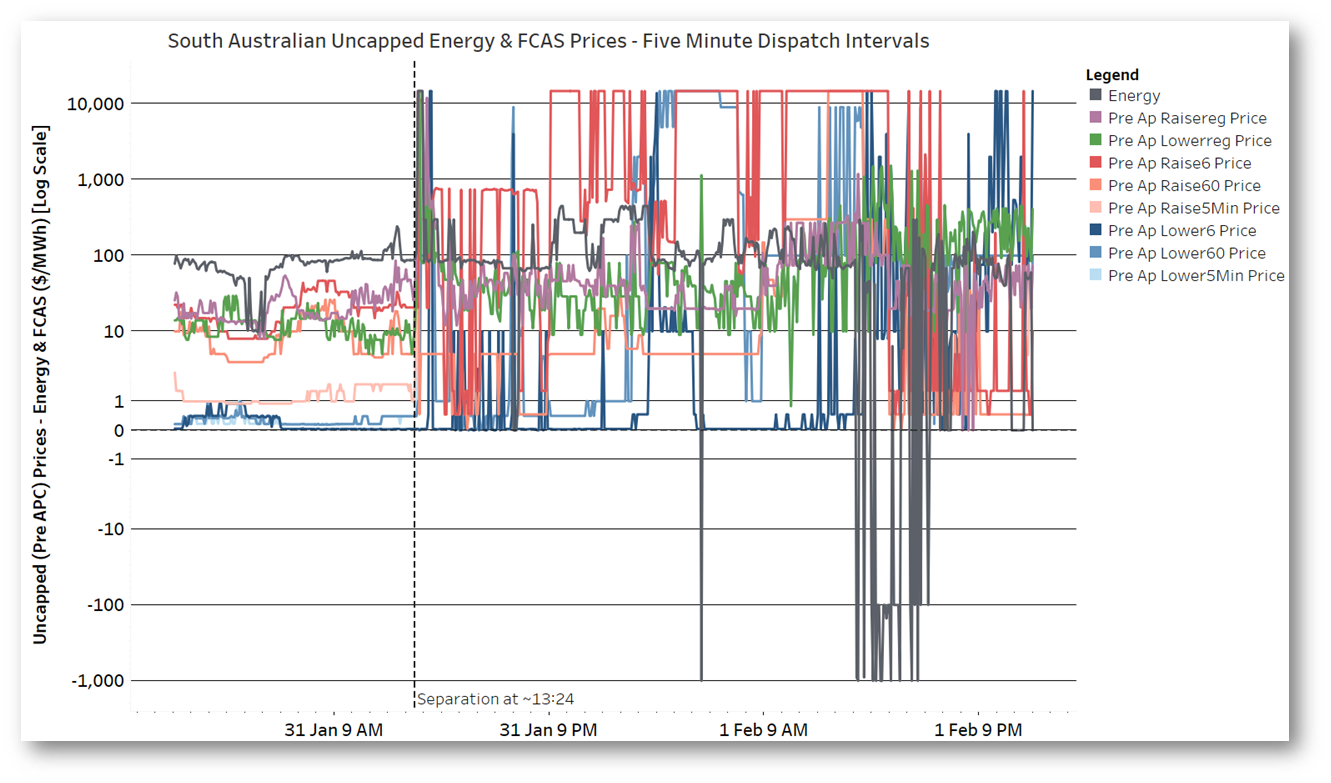
We can see this even more starkly by looking at five minute FCAS prices over Friday 31 Jan and Saturday 1 Feb, again on a log scale:
This shows prices for many FCAS products jumping about wildly after separation, with extended periods at $14,700/MWh for a couple of products (the “Raise 6 second” and “Lower 60 second” services).
The energy price, by contrast, became only moderately more volatile – at least until the period of prices crashing to -$1,000/MWh on the afternoon of 1 February.
Indicated on the chart are periods of “Intervention Pricing”, where as a result of directions being issued to some participants in South Australia to maintain system security, prices may have been set by a supplementary process which estimates what prices would have been in the absence of those directions – a provision of the market rules that attempts to minimise “distortion” to price signals when security directions are necessary.
The chart also shows FCAS prices suddenly being capped (at $300/MWh) at about 7:30 in the morning on 1 Feb. This was due to the automatic operation of the NEM’s Administered Price Cap – under the market rules this occurs after average prices for any single product over the previous seven days (calculated on a rolling five minute basis) exceed approximately $658/MWh. (If that number seems odd, it’s essentially equivalent to 7.5 hours at the Market Price Cap). Once any FCAS price hits this threshold, all FCAS prices are then capped at $300/MWh (until the rolling average of the underlying uncapped prices falls below the threshold).
AEMO continues to publish these underlying uncapped prices after the APC is applied, and plotting these we can see that extreme prices would have continued had the cap not kicked in:
What Was Driving This Volatility?
The complexities of FCAS price-setting, particularly the joint coöptimisation of energy and FCAS, would make a full answer to this question a very long thesis in itself. “Coöptimisation” refers (in part) to the way that supply of energy and supply of FCAS interact at individual supplier level – often taking more or less energy output from a generator (or battery) can lead to changes in the quantities of FCAS services it is able to provide. Depending on the relative offer prices for energy and affected FCAS services, AEMO’s market dispatch process chooses the most economic overall combination of energy and FCAS supply across the entire market (or region, in the case of the South Australian island). This process also means that the resulting dispatch price for energy or a single FCAS product can reflect not just offer prices for that product, but a complex blend of offer prices for all interacting products.
A further complication is the action of intervention pricing in some periods due to security directions, which can effectively drive a wedge between physical supply-demand outcomes and published reference prices (because intervention pricing uses a counterfactual supply-demand analysis, removing the effect of directions, to derive these prices).
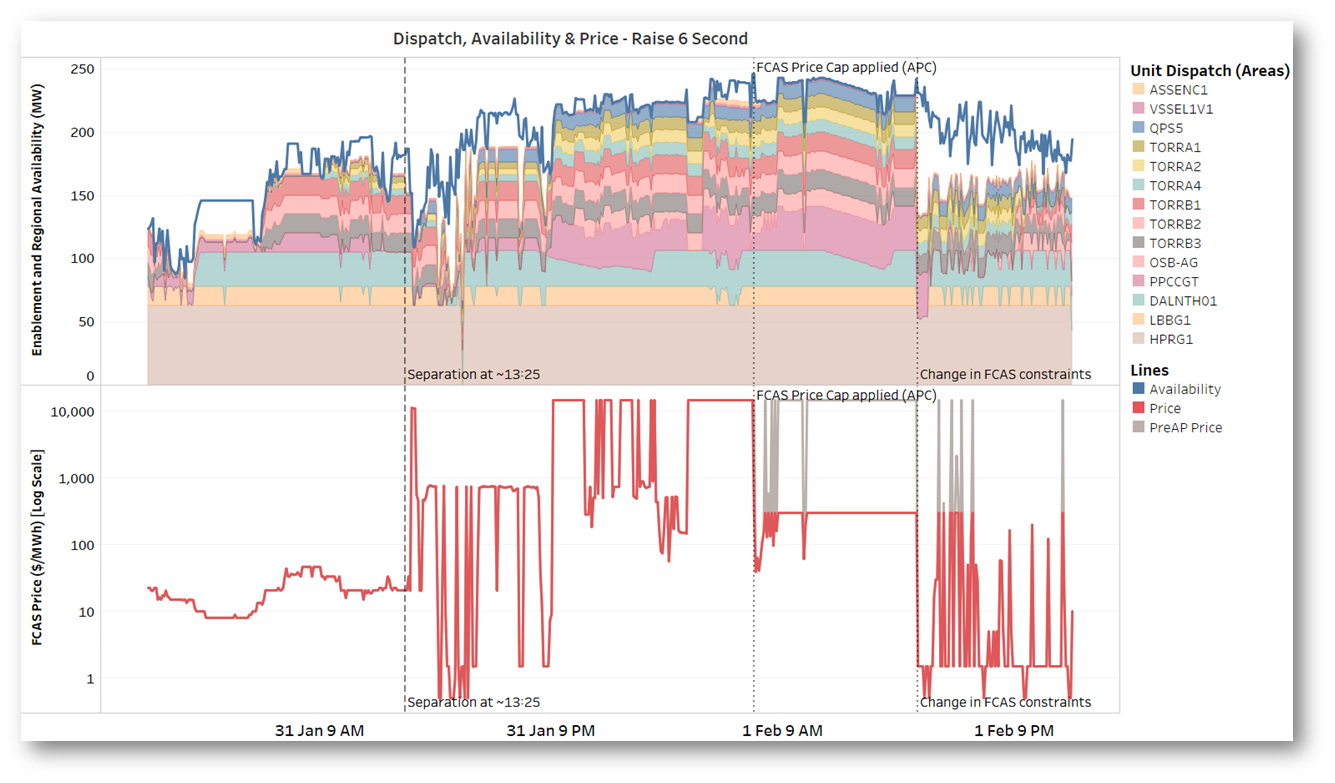
Complexities aside, we can still get some very rough, high level sense of FCAS price drivers by looking at how much of the relevant product was being called on by AEMO before and after the separation event, how much was available, and the combination of suppliers dispatched to provide it. Here’s a five minute view for Raise 6 Second FCAS, whose price leapt right up to the market price cap of $14,700/MWh during the evening of 31 Jan and stayed there well into Saturday 1 Feb, until the APC kicked in:
The top panel shows the overall availability of the service (total volume offered) in South Australia – the blue line – and the quantities “enabled” (dispatched) for each supplying unit as coloured areas. The lower panel shows prices – both capped (after 7:30am on 1 Feb) and the underlying uncapped (“PreAP”) price.
Lots of important observations from this one chart (many of which might be applicable to corresponding analyses for the other FCAS services, left out of this post for space):
- There’s a restricted set of suppliers. In the case of conventional generators for most FCAS products, only units actually online and producing energy are capable of supplying. And in South Australia only three out of the state’s twenty-two windfarms have developed the capability required and chosen to offer FCAS products (although others may now regret not having followed suit).
- Here we can see the Raise 6 Second service being provided by three supplier subgroups:
- utility-scale batteries; Hornsdale Power Reserve (the original “Tesla big battery”), and the more recently commissioned Lake Bonney and Dalrymple North batteries
- larger online gas-fired generators; Pelican Point, Osborne, Torrens Island (six online units), and Quarantine
- for very small amounts in some periods, two demand-side providers which have recently registered to provide FCAS: the Tesla home battery Virtual Power Plant (“VSSEL1V1”) and an aggregated commercial load reduction service (“ASSENC1”) originally established by Enernoc, now Enel X.
- Overall availability often jumps around rapidly – but this is not due to suppliers deciding every five minutes to change their offers. It’s an outworking of coöptimisation and the interaction between energy output and FCAS capability for some generators: as different amounts of energy are dispatched from different generators to meet demand, FCAS availability changes.
- Both pre- and post-separation, around half of this service in SA was being provided by the three large batteries. Although it’s not clear without deeper analysis, I suspect there would have been a significant overall shortage of this FCAS service after separation had these batteries not been in operation. (Remember that pre-separation, FCAS could generally have been supplied from anywhere in the NEM, so levels actually dispatched in SA broadly depended on relative offer prices in and outside the state, rather than the region’s own FCAS requirements. But after the electrical separation of SA, those requirements could only be supplied from local providers.)
- Price leapt in the immediate aftermath of the separation but was generally below $1,000/MWh for the first seven and a half hours. The overall volume of dispatch (top of the coloured area series) was similar to or lower than that prior to separation, so my hunch is that prices probably jumped because of the sudden restriction on available suppliers, and possibly complex interactions with energy and other FCAS products’ local availability and pricing under coöptimisation. Intervention pricing may also have played a part here.
- After this seven and a half hour period, overall quantities dispatched increased materially, and in most periods all volume available in SA was being used. This corresponded with the price rising all the way to $14,700/MWh for many dispatch intervals, ultimately resulting in application of the Administered Price Cap (but with the underlying uncapped prices continuing to sit mostly at $14,700/MWh).This increase in FCAS requirement aligned with generation at Mortlake in Victoria ramping up to a level required to closely match energy demand from the Portland aluminium smelter, reducing any net draw from South Australia, to which both Mortlake and Portland remained connected after the transmission line collapse to their east.
While balancing of Mortlake supply with Portland demand appears to be the most secure way to operate the extended South Australia + south-west Victoria island, increased generation from Mortlake had the side effect of significantly increasing the amount of Raise 6 Second FCAS required to secure the South Australian system against the risk of a Mortlake unit tripping. This led to the price of this service hitting the Market Price Cap of $14,700/MWh.
- Then at 4pm on Saturday afternoon there is a sudden drop in dispatch volumes, with prices falling significantly. This coincided with AEMO removing the Mortlake FCAS constraint which had pushed up the required volumes of Raise 6 Second FCAS. This may reflect AEMO having had further time by then to develop technical approaches to management of the extended SA island that allowed it to reduce the requirement for this service.
Show Us The Money
While all that detail is no doubt fascinating (and still just scratching the surface), what were its financial impacts?
If you’ve been following carefully you may remember that I mentioned early on that FCAS value was typically a few percent of the wholesale value of energy.
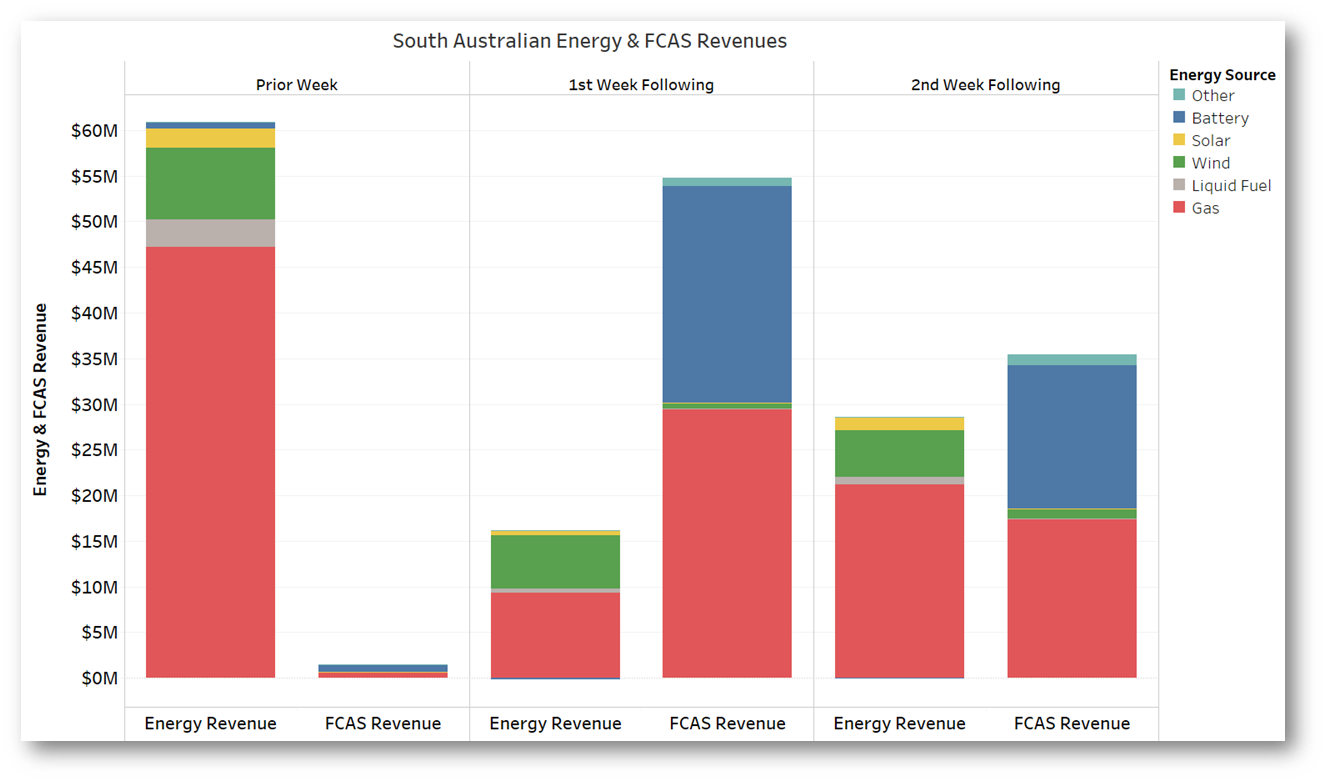
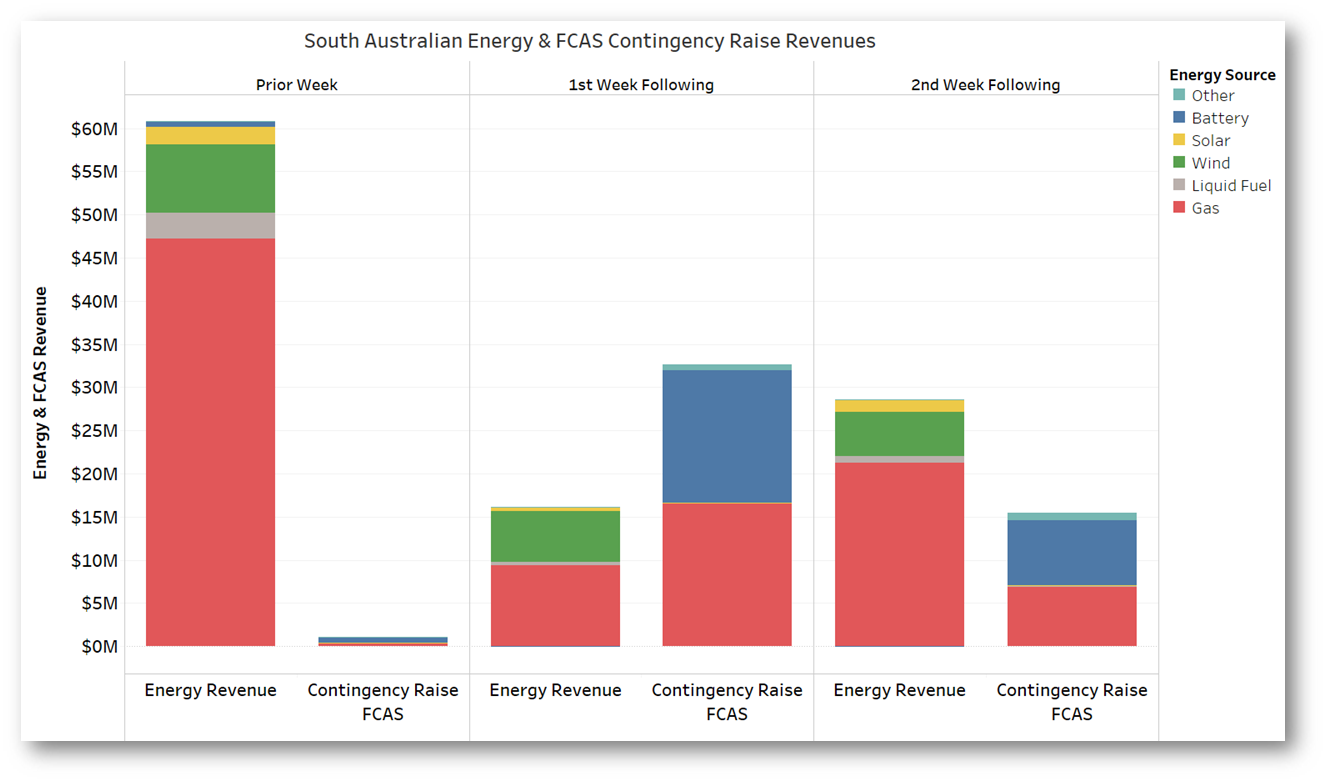
Here’s a chart showing wholesale energy vs total FCAS revenues for participants in South Australia in the week prior to, and then the two weeks after the separation event. I’ve broken down revenue by energy source of the providers:
If nothing else from this post sinks in, that certainly should. In the seven day period (actually 2,106 five minute dispatch intervals) prior to islanding, total FCAS revenues ($1.5M) were equivalent to less than 2.5% of wholesale energy revenue for South Australian suppliers ($60.8M). In the seven following days, FCAS revenues ($54.8M) were over three and half times larger than energy revenues ($16.0M). In the next week energy prices and revenues were up and FCAS prices down somewhat, but there was still more value in FCAS provision than energy.
It’s also fascinating to see just who earned big from the elevated FCAS prices. Gas generators and batteries dominate, the former not surprisingly given the major role they still play in energy supply and the fact that few other generators supply FCAS services in South Australia. But the FCAS revenues earned by batteries were way above their share of market capacity (and of course they are actually net energy users not producers), and windfall gain or no the size of their revenues – $40M across the two weeks post-separation – points to just how significant their role as suppliers of system stability and balancing services has become in a short time. Also noteworthy was the $1M per week earned by “other” suppliers – this was entirely the two newish demand-side FCAS suppliers, the Tesla VPP and Enel X’s load reduction offering, each of which currently offer only a few MW of FCAS capability.
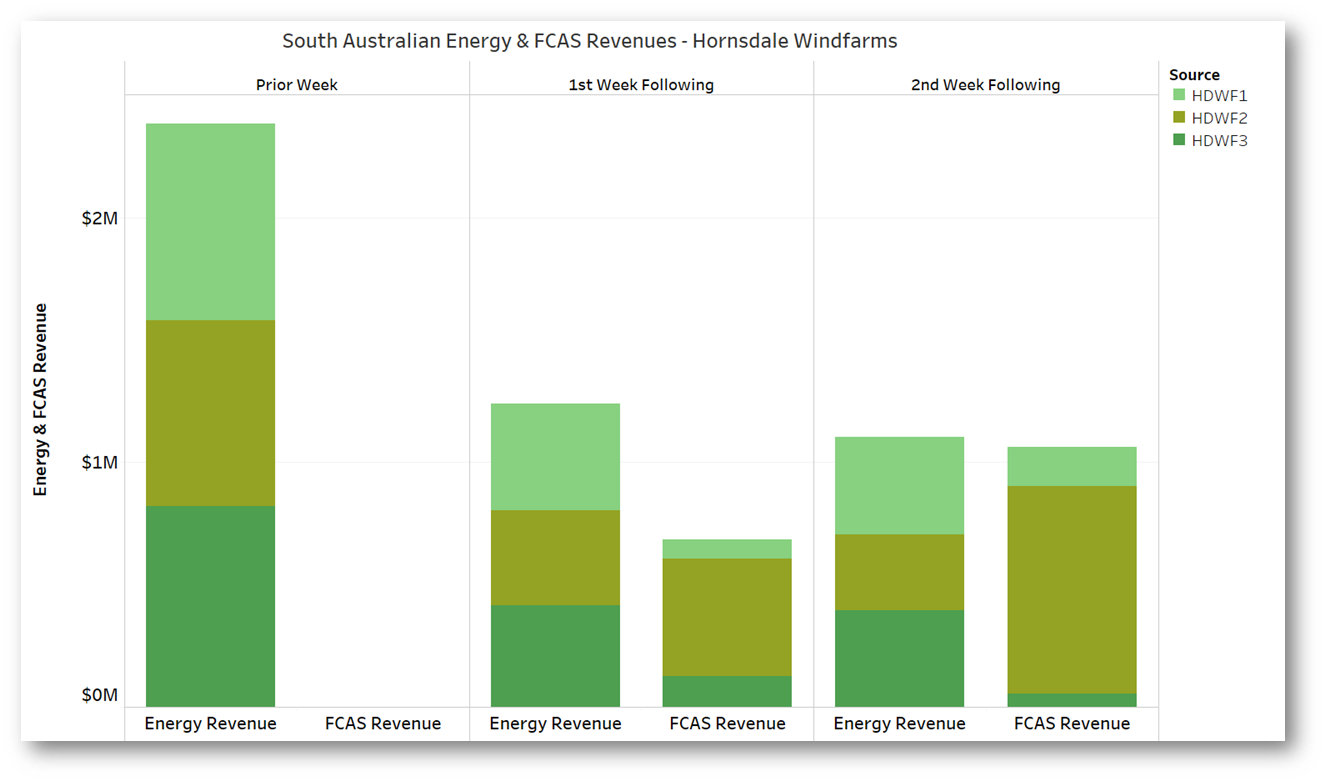
On the other hand, wind generators as a group earned far less from the FCAS windfall. (Solar and liquid fuel generators provided no FCAS at all). The wind share of FCAS was entirely earned by the three Hornsdale wind farms, the only renewable generation FCAS providers in South Australia. It’s instructive to look at their revenue breakdown:
The fact that as a group their FCAS revenues were below their energy revenues generally reflects that it is technically more difficult for windfarms to offer FCAS (although this seems not the case for Hornsdale Stage 2 which earned the lion’s share of FCAS income); the volumes they can offer tend to be smaller (as a proportion of nameplate capacity) than for conventional generation, and much smaller than batteries which can provide their full nameplate capacity for many FCAS services. Windfarms’ ability to provide FCAS also varies with wind conditions. But the roughly $1.8M the Hornsdale windfarms did earn in these two weeks was still infinitely higher than SA’s other wind, and solar, farms.
But Who Pays?
Market participants as a group have to cover the total cost of the revenues paid by AEMO to FCAS suppliers. Earlier I mentioned the complexities of FCAS price-setting; well, the way FCAS costs are allocated out can become mind-numbingly complicated and intricate and makes FCAS pricing look pretty easy.
At a high level, the principles seem straightforward:
Generators bear the cost of the three “contingency raise” services – 6 Second, 60 Second, and 5 Minute.
Market Customers (typically Retailers) bear the cost of the three corresponding “contingency lower” services.
Generators and Market Customers share the cost of the two “regulation” services – Raise Regulation and Lower Regulation.
But below that, the details of how costs are grouped up and then allocated across regions and to individual generators and market customers are genuinely eye-wateringly complex and arcane, in the case of Regulation depend indirectly on details of production levels measured down at four-second intervals. So I’ll make just a few observations:
- After islanding, the entire cost of the three Contingency Raise FCAS revenues paid to providers in South Australia would have been borne by South Australian generators. Here I’ve reproduced the previous chart of revenue splits, but limited the FCAS revenues shown to these three services:
In the first week after separation, generators in SA as a group would have paid out roughly twice in contingency raise FCAS costs what they earned from selling energy. Half these costs went as FCAS revenue to batteries (who would have borne no significant FCAS costs) and the other half almost exclusively to gas generators, who were thus “on both sides of the trade”. (And remember that these charts exclude the portion of Regulation FCAS costs also borne by generators.) You don’t have to be too clever with arithmetic to deduce that wind and solar generators were the big losers.
(As an interesting aside, although Mortlake is operating in the extended SA island along with the Portland smelter, I doubt that it bears any of these costs, because it is registered as a Victorian generator – if anyone has information to the contrary, please let me know)
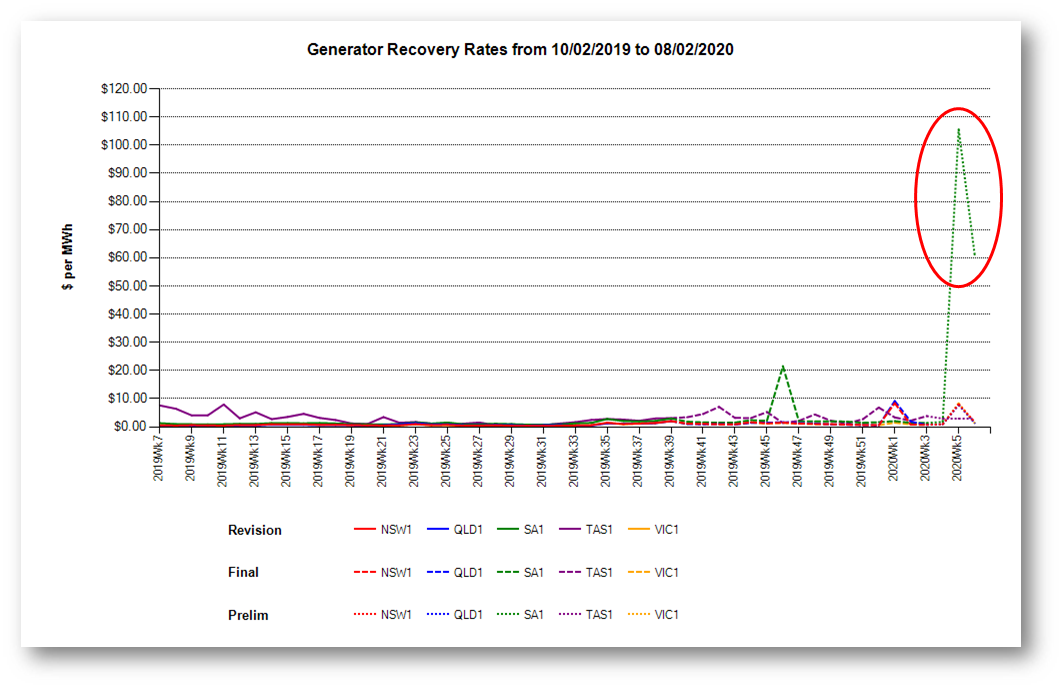
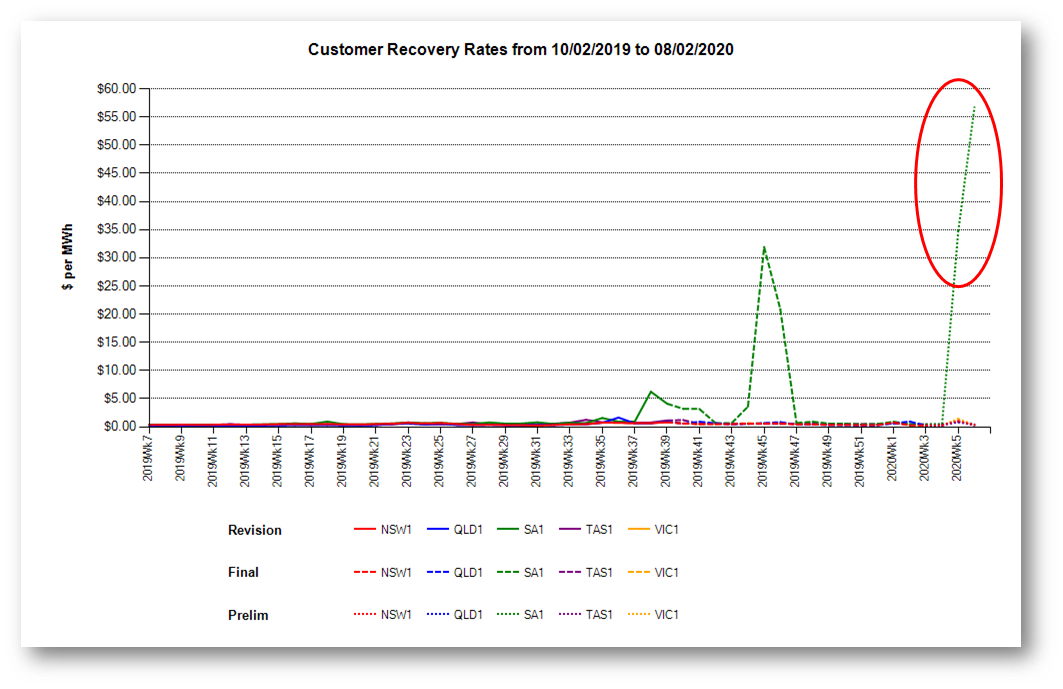
- AEMO don’t provide public data on allocation of FCAS costs to individual parties (although with a lot of effort, bordering on heroic, estimates can be made from underlying dispatch data – as was done for the 2019 Generator Statistical Digest). However AEMO does provide weekly snapshots of total amounts recovered from generators and market customers, and maintains a couple of charts expressing these weekly costs in aggregate $/MWh terms over the last year – the last two weeks charted below include days in the SA islanding period and obviously that region stands out:
(It’s important to reiterate that for individual generators and market customers, their effective FCAS recovery cost per MWh produced or consumed may be very different from these region-wide averages – due to the complexities of the cost allocation algorithms)
- Reinforcing Paul’s original point (and one I made in commenting on aspects of the GSD2019) generators who don’t fully understand their exposure to FCAS, and have not developed mitigation strategies – even partially, perhaps through developing capabilities to become FCAS providers like the Hornsdale wind farms – can leave themselves open to very nasty surprises.
One Final Question
If nothing else, all the analysis above shows just how volatile and consequential the usually quiet FCAS markets can become under unusual circumstances.
The current circumstances in South Australia are not just unusual, but quite unprecedented with the very large smelter load at Portland and “orphaned” gas generators in south-west Victoria hanging off a long isthmus of the South Australian island, and a repair time of weeks just to get a temporary reconnection in place to the rest of the NEM.
I wonder how desirable it is – from a policy and regulatory perspective – to have these very complex markets continuing their “normal” operation in such highly abnormal circumstances, resulting in these extreme price and financial outcomes? I’m sure there are some strong views on this being expressed by some participants in South Australia as they open their weekly settlement statements from AEMO!
About our Guest Author
 |
Allan O’Neil has worked in Australia’s wholesale energy markets since their creation in the mid-1990’s, in trading, risk management, forecasting and analytical roles with major NEM electricity and gas retail and generation companies.
He is now an independent energy markets consultant, working with clients on projects across a spectrum of wholesale, retail, electricity and gas issues. You can view Allan’s LinkedIn profile here. Allan will be sporadically reviewing market events here on WattClarity Allan has also begun providing an on-site educational service covering how spot prices are set in the NEM, and other important aspects of the physical electricity market – further details here. |


Great article Alan.
The graph for Raise 6 Second FCAS shows the Hornsdale battery providing what looks like around 60 MW continuously for days. I thought it was a roughly 100 MWh battery. So how does it provide a continuous 60 MW FCAS supply? Any ideas? Is it being kept charged by the Hornsdale wind farms?
Fair question Paul. The so-called “contingency” FCAS services, including Raise 6 second, only require a supplier to rapidly deliver (or consume) extra energy when there is a significant frequency disturbance. So 99.x% of the time, a battery can provide this service without actually having to discharge. This is one of the major reasons, along with quick response and excellent control, that batteries have been able to occupy a large share of the market for this service. Allan.
PS So just to clarify, for these services, providers are being paid to provide a #response capability# measured in MW over a period of time measured in hours – hence paid in dollars per megawatt-hour of capability not energy, if that makes sense.
Near the beginning of this great explanation you stae “… subset of Ancillary Services supporting frequency control – keeping supply and demand in close real-time balance, reflected in system frequency staying within a narrow band around 50 Hz and returning quickly to that band if a disturbance shifts it.
Isn’t more of a phase shift correction that’s required? A frequency shift would have generators being at opposite phases for some number of cycles, thus a current short-circuit that increases and decreases as the generator phases slip through the 180 degree point — or the 120 degree point assuming this is a three-phase grid. Can transformers, generators etc. survive such frequency slippages?
Ike, I think you’re talking about “pole slip” or “loss of synchronism” events which have to protected against – very quickly – for individual generators or across interconnections. When supply and demand get out of balance for some reason the natural response of a synchronous system is to slow down or speed up through inertial effects, manifested in system frequency falling or rising (my original wording about “frequency shifts” may have been slightly rough, it’s really frequency *deviations* that FCAS respond to). Frequency control ancillary services provide controlled injections or withdrawals of power over various timeframes to arrest and correct these frequency changes. But if rates of change of frequency (RoCoF) are too high then yes that can lead to those phase angle problems you refer to which may even lead to system collapse.
So my understanding is for both regulation FCAS and contigency FCAS, we sell the generation ability, not the real generation. Am I right?
And the FCAS dispatch interval is 5 minutes right? For each 5 minutes interval,regulation fcas and 6s/60s/5minutes contigency FCAS just account once, calculate the revenue and sum them up.
If I am right, what confuse me is that the price difference between regulation FCAS and 5 minutes FCAS is large.These value should be close?
Correct:
1) FCAS is paid for ‘Enablement’ rather than for actual use.
2) Payments made for each discrete 5 minute period
With respect to your question about the difference in price between Regulation FCAS and Contingency 5-min, the answer ultimately comes from the fact that they are different commodities, with different suppliers, and different size of requirement.
Thanks for clarifying Paul
There is one subtlety to the Regulation and 5 Minute Contingency services that shaojing may have been thinking of:
Regulation capability can be used to deliver 5 Minute contingency response, as it is a slow enough service to be dispatched via AGC (unlike 6 second and 60 second Contingency).
Also note that Regulation and 5 Minute Contingency services are not mutually exclusive – a unit on Regulation duty is also able to provide 5 Minute contingency in the same dispatch interval.
AEMO therefore cooptimises delivery of the two services by including Regulation offers in the constraint formulation for 5 Minute Contingency (but not the other way round, as 5 Minute contingency can be offered by generators or loads which can’t provide Regulation – eg loads which offer only Contingency Raise services, or very fast start generators like hydro units which may be off and thus unable to provide Regulation at the start of the relevant dispatch interval, but can start up rapidly to deliver 5 Minute Raise).
Typically, more 5 Minute contingency capability needs to be enabled than the required volume for the Regulation service. This can sometimes mean that the amount of Regulation capability enabled to satisfy the 5 Minute contingency requirement *exceeds* the total amount required for the Regulation service itself – this depends on the volumes and relative prices of Regulation vs 5 Minute Contingency offers. It doesn’t happen that often – perhaps in a few percent of dispatch intervals.
In these circumstances the prices for Regulation and 5 Minute contingency FCAS will be equal, as it is effectively the 5 Minute contingency market that is determining the value of Regulation offers.
In any case, the Regulation FCAS price will always be higher than or equal to the price for 5 Minute contingency, never lower. You can think of this as reflecting the Regulation service being inherently more valuable than the 5 Minute service because the former can substitute for the latter but not vice versa.
Allan
Just notice. really thanks for your help, sorry for bothering you agian.
just a little confused about some other questions.
1.Whether the 3 kinds of contigency raise FCAS are mutually exclusive? For example,I have a 100MW BESS, can I take part in 100mw 6s contigency raise, 100mw 30s contigency raise and 100mw 5min contigency raise?
2.If we can, when emergency happens, we just need supply 100mw, right? Also if we find we can not supply energy?(maybe caused by fault) Can we withdraw the bidding or can we withdraw the FCAS service even though we win the bid?
I think Jonathon has already answered your question 1 below.
Re 2. the response provided to a contingency should be proportional to the frequency deviation. This is explained in AEMO’s Market Ancillary Services Specification documentation. Regarding inability to respond due to a fault, if known about in advance, offers can be withdrawn at any time up to about 90 seconds before commencement of every 5 minute dispatch interval. Once accepted for enablement, offers can’t be withdrawn within a dispatch interval but can be withdrawn or modified for succeeding intervals. “Acceptance” of FCAS and energy offers is not forward-looking beyond the horizon of each 5 minute interval.
A little confused about a question.
Whether a 100mw/100mwh storage system can take part in all 8 100mw FCAS(100mw reg raise/100mw reg low/100mw 6s contigency raise……). Or for raise/low, the sum of total is 100MW(for example 50MW reg raise/ 30mw 6s/10mw 60s/10mw 300s)?
Hi Shaojing,
It can be a little confusing but most batteries can take part in all services, even all at the same time, depending on the technology being used. You are right that it is the summation of energy targets, regulation enablements and max enablement of all FCAS services must be less than or equal to the max capacity – its the joint ramping constraint.
Paul Mcardle has my details if you want more info.
Cheers