Amongst the many interesting days we saw in the NEM through the 2024* calendar year Monday 16th December 2024 was one of those, for several reasons.
* for those interested to learn more, Dan Lee’s year-in-review summary ‘What you might have missed on WattClarity this year: NEM wrapped 2024’.
(A) What’s already noted, about Monday 16th December 2024
We’ve already written 20 separate articles (collated here) about that day. Scanning the titles of the articles we see:
1) This was another day in which there were earlier forecasts of LOR3 (i.e. a severe supply-demand balance forecast sufficient enough to flag possible load shedding) for the NSW region;
2) Whilst this did not actually progress to the point of dispatch, we did see:
(a) A level of NEM-wide ‘Market Demand’ that was highest in 4 years; and also
(b) A level of NEM-wide ‘Underlying Demand’ up above 38,000MW … so very high, in historical context
3) In large part because of extreme temperatures … with some parts of Victoria hitting 47°C for the first time since Black Summer.
4) Amongst the many interesting events on the day, we’ve noted a number of interesting outcomes for units in Victoria … and particularly for Wind Farms.
(B) More exploration of Victorian Wind Farms (as time permits)
On the following day (on Tuesday 17th December 2024) we posted this ‘Part 2 in a review of bidding, on Monday 16th December 2024 (a focus on VIC Wind Farms)’ article … with interest being for several reasons, including the high temperatures experienced on the previous day (Monday 16th December 2024) and questions about possible high temperature effects on output.
We followed that by identifying ‘Where are those Semi-Scheduled Wind Farms in Victoria that were reviewed w.r.t. Monday 16th December 2024’, including a map that we’ll refer back to in this article, and also subsequent article (time permitting). We’re particularly interested to do this for several reasons, including the following:
Why #1? … The Energy Transition VRE + Firming
Notwithstanding the emergence of the LNP’s stated plans for course change into nuclear, it seems that much of the adopted wisdom of the ‘powers that be’ is such that we’re all proceeding down at Energy Transition path that is:
1) moving from a historical model of ‘Baseload + Peaking’
2) towards an envisaged future model of ‘VRE + Firming’.
Whilst it seems increasingly likely in this energy transition model that rooftop PV is going to destroy any business case* for Large Solar, the case for Wind seems somewhat more robust (and necessary) in these scenarios.
* which did have us scratching our heads about why so many stand-alone Large Solar projects featured in the end-of-year CIS round!
As such, we’re striving to learn as much as we can about how wind farms are actually performing across the NEM
Why #2? … What that means for our business
We (at Global-Roam Pty Ltd*) are very focused on helping our clients navigate the energy transition. That means the owners and/or operators of the growing number of wind farms will continue to be likely clients for our services.
* Global-Roam Pty Ltd is both:
(a) the providers of this WattClarity service
(b) and developers of the ez2view software (amongst other software products)
(c) amongst other initiatives.
(B2a) Our software
Through 2024 (summary coming soon here) we certainly saw an uptick in interest in, and commitment to, our ez2view by parties associated with Wind Farm development and/or operations across the NEM.
We’re keen to continue our own journey of learning and discovery, in order that we can feed the insights we form into future enhancements to our ez2view software.
(B2b) Other investments
Worth re-iterating that in early 2024 we (at Global-Roam Pty Ltd*) contributed a seed investment in another early-stage start-up focused on providing self-forecasts to a growing number of Wind Farms (including some listed below). This investment has followed from our growing interest in helping to make the energy transition actually work, by providing assistance in various ways, as we can.
The fact that we have now made this investment gives us one more reason to take a keen interest in the operations of wind farms. Hence we share some insights with WattClarity readers here today.
#3 … so read this as our attempt to Learn More
As such, this series of articles should be read as our own exploration of an interesting (and challenging) time for wind farms in Victoria – some insights shared but (perhaps more importantly) a number of questions asked, in the process of continuing our own learning journey.
Perhaps some of our more learned readers can help us in our journey by providing more context about the questions we are asking … either as comments below, or directly one-on-one?
(C) Four Victorian Wind Farms in the GPG portfolio
Later in December we started to look at individual wind farms in more detail – including, but not limited to, these four Wind Farms that are in the GPG Portfolio (given the common patterns and questions across all 4 noted earlier). We’ve only found time to finish this off today (topical, given the next round of hot weather rolling in over the current weekend).
We can see from that map that there are two clusters of two wind farms each:
(C1) First cluster, in the Western Plains
The project website notes that:
‘Berrybank 1 wind farm is located in the South-Western Victoria approximately 14km east of Lismore, 80km west of Geelong and 130km west of Melbourne, in the region known as the Western Plains, located within the Corangamite and Golden Plains local government areas.’
This WattClarity map shows how Berrybank 1 and 2 are located quite close together. Let’s use walk through each in turn …
Berrybank 1 Wind Farm … on Monday 16th December 2024
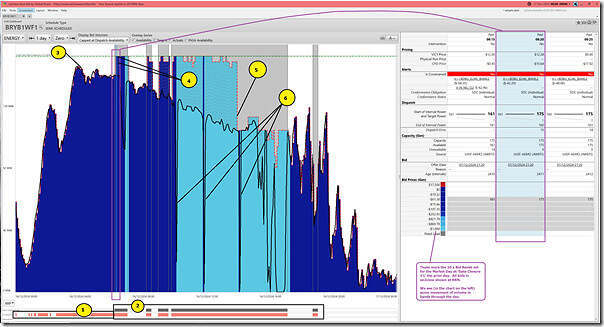
Let’s start by using a copy of the ‘Unit Dashboard’ widget in ez2view v9.10.1.297 (i.e. the ‘Latest & Greatest’ version released Friday 3rd January), time-travelled back to 24:00 at the end of the day on Monday 16th December 2024 and looking back 24 hours:
With respect to the numbered annotations …
Constraints and the Semi-Dispatch Cap
1) Earlier in the morning (until the 06:15 dispatch interval NEM time) there had been some constraint equations bound with BRYB1WF1 on the LHS … and yet the Semi-Dispatch Cap flag had not been set.
(a) This was because these constraint equations were acting to ‘constrain up’ the output of the farm.
(b) These included:
i. the ‘V::N_NIL_V2’ constraint equation – which had an operator of <= and a negative LHS factor for Berrybank (and others).
ii. the ‘V::N_NIL_O2’ constraint equation
iii. and possibly others.
2) However from the 06:15 dispatch interval (NEM time) there were a different series of constraint equations bound:
(a) which had the effect of ‘constraining down*’ the BRYB1WF1 unit
* notwithstanding that the effect is more of capping the output of Semi-Scheduled wind farms (noting the AER Rule Change).
(b) as such, the Semi-Dispatch Cap flag was set.
Downwards trend of Actual Output
3) We see that (tracking the black line, which shows the trend of FinalMW) there was a fairly steady downwards trend of Actual Output from a peak on the day in the 03:45 dispatch interval
Two methods for estimating/forecasting Availability in AWEFS
4) In parallel with the SDC periods (though offset by 5 minutes) we see some interesting things related to Availability and Target.
(a) Note that for all four of these wind farms there are no self-forecasts deployed:
i. … which means that all of them utilise AWEFS throughout all 288 dispatch intervals in the day
ii. That makes this analysis simpler, in a way (i.e. not requiring the consideration of yet one more variable).
(b) We can see that, from the second SDC interval the Availability (i.e. dotted red line) shoots upwards …
i. to the Maximum Capacity of the unit (175MW), in many cases
ii. or 171MW (i.e. 4MW below MaxCap) on occasions or 167MW (i.e. 8MW below MaxCap)
(c) Despite the form of the constraints being to ‘constrain down’ the output of the farm (hence triggering the SDC) the state of the bid (i.e. bid below the CPD Price) means that on most occasions:
i. the unit is given a Target to ramp up significantly;
ii. but, on each of these occasions, the Actual Output continues its steady trend of decline.
… we hypothesise that this happens because:
Hypothesis Part 1) the AWEFS process utilises two different forecasting methods:
i. When the SDC is not flagged, the unit is free to produce output to the extend the wind resource allows, so AWEFS can use a ‘persistence’ logic (i.e. what the capability will be in 5 minutes will be roughly what the actual output is now).
ii. Whereas 5 minutes into a SDC period, that logic does not necessarily apply … so it switches to a different method (incorporating number of turbines in service, assessed wind speed and a power curve).
Hypothesis Part 2) It’s clearly during SDC periods that the the AWEFS process struggles on this day.
… though that is for reasons unknown at this point
Step change downwards
5) We see that for this unit at the 14:00 dispatch interval (NEM time) the Availability drops sharply to 120MW, which is down where the Actual Output had trended to that point.
… for reasons unknown at this point.
Effects of rebidding
6) Finally, we’ve noted that there were some periods where the Actual Output followed the Target in dipping sharply, as follows:
(a) From 06:35 the CPD Price dropped to –$61.38/MWh, which is where volume had been allocated.
… we can see that rebids shifted volumed down to –$1,000/MWh as a result, reversing that trend in the Target.
(b) From 09:55 the CPD Price dropped to –$61.38/MWh, which is where volume had been allocated.
… we can see that rebids shifted volumed down to –$1,000/MWh as a result, reversing that trend in the Target.
(c) Just for the 11:50 dispatch intervals, volume shifted from –$1,000 (below the CPD Price) up to –$61.38/MWh (well above the CPD Price), as a result of which:
i. The unit was ramped down; and
ii. A rebid triggered the reversal of that shift in volume;
iii. So output jumped up again.
(d) A similar thing happened for 14:05
(e) And so on…
As you can see, in each of these instances, the bid was at-or-above the constraint-suppressed CPD Price (which means that the unit was then ‘constrained down’).
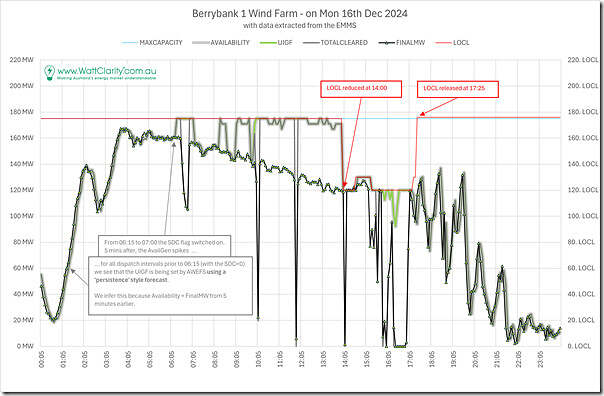
So following from the above, we have several questions that were not answered in the way we’ve currently designed the ‘Unit Dashboard’ widget in ez2view, so we’ve extracted some other data to Excel (in part utilising the ‘Trends Engine’ in ez2view) to present the following three additional trends:
In this second chart we can see the answer to one of the questions flagged above:
1) At the 14:00 dispatch interval, the LOCL (Local Limit)* was reduced to 120MW
* this is a relatively new data set that the AEMO begun publishing in mid-August 2024, as noted in the article ‘AEMO commences publishing actual intermittent generators (SCADA) availability data to the EMMS Data Model’..
2) This feeds into the AWEFS process:
(a) and, as a result, produces a more accurate forecast
(b) we can clearly see this in the case of this unit on 16th December 2024 with the Availability being adjusted down to something much more like what the unit capability had trended down to.
3) However we’re still not clear on what was actually affecting the Availability in the first place.
(a) given the talk about the high temperatures on the day, we wonder if it is possible (with the data we have available) to see if high temperatures had some effect?
(b) this is one question on which we’d appreciate input from more learned readers!
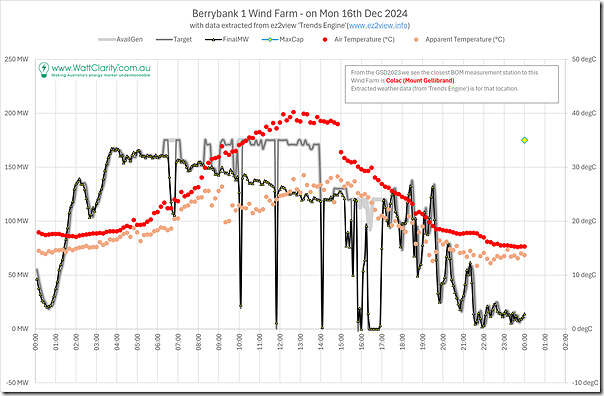
In this third chart we have plotted the same high-level data of the output profile, but have replaced the local limit with some temperature data at the nearest BOM measurement location:
We chose measurement location as ‘Colac (Mt Gellibrand)’ because that’s what was calculated in the ‘A’ Page of the GSD2023 around 12 months ago as the nearest measurement point ‘as the crow flies’ (of the BOM measurement locations for which we collect data). You can check this WattClarity map to see for yourself.
From this chart we can see:
1) Air Temperature* ramp from ~08:00 (NEM time) to quite high levels.
* remembering that this was measured at Colac (not onsite), and not at hub height either.
2) But this ramp up in temperature comes several hours after the output of the wind farm began to decline (from ~04:00 NEM time), so it’s not clear the extent to which high temperatures were a factor?
… reaching out to more learned readers to help us out here?
3) Interestingly we see that Apparent Temperature is considerably lower … which (I think) suggests high wind speeds.
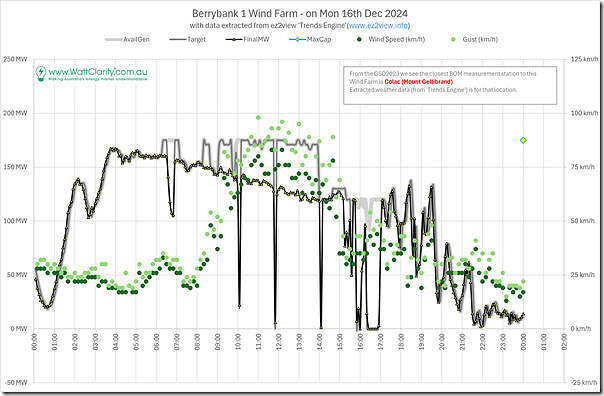
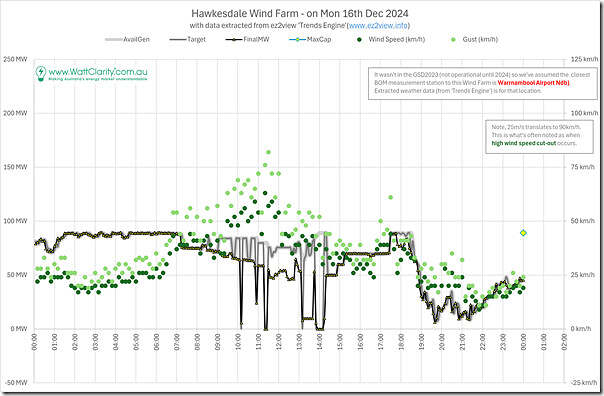
In this fourth chart we have plotted the same high-level data of the output profile, but have changed the BOM data (i.e. replacing temperatures with wind speed):
Readers are urged to remember that these wind speed readings are close to, but not actually at the site of the wind farm … nor are they at the hub height of the rotor. So:
1) they are not an exact match with what could be used in (e.g. as noted in this precis, we applied additional logic in the process of completing Appendix 27 within GenInsights21).
2) but we wonder about the extent to which they are directionally consistent.
In simple terms:
1) It certainly does not look as if there was a downwards trend in wind speed throughout the morning whilst the output profile trended down
… i.e. it seems unlikely that the drop in output was due to a drop in wind speed
2) Conversely, a wind gust approaching 100km/h is above 25m/s, which is at the point where other sources note that high wind speed cut-out occurs on occasions.
(a) So we wonder if this (possibly in addition to possible high temperature effects?) was a factor on Monday 16th December 2024?
(b) Albeit noting that the decline in output commenced earlier in the morning … before wind speeds began to climb.
(c) We’d be particularly appreciative if some of our more learned readers could provide their thoughts (either in comments below, or one-on-one direct with us)!?
Berrybank 2 Wind Farm … on Monday 16th December 2024
Here are the same 4 x charts for Berrybank 2 Wind Farm … note the common patterns with the sibling unit Berrybank 1 Wind Farm.
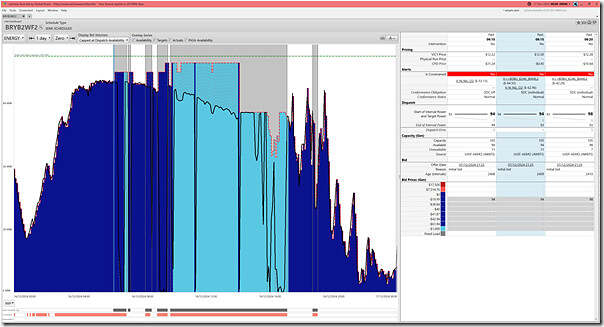
We’ll start with the snapshot from the ‘Unit Dashboard’ widget in ez2view focused on BRY2WF2:
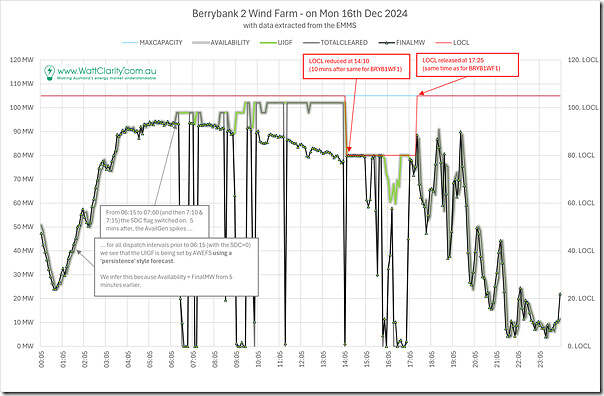
Here’s the trend including Local Limit (LOCL):
Again, we see that the (manual?) adjustment of LOCL was strongly correlated with (and probably linked to) the drop in Availability coming out of AWEFS for the wind farm.
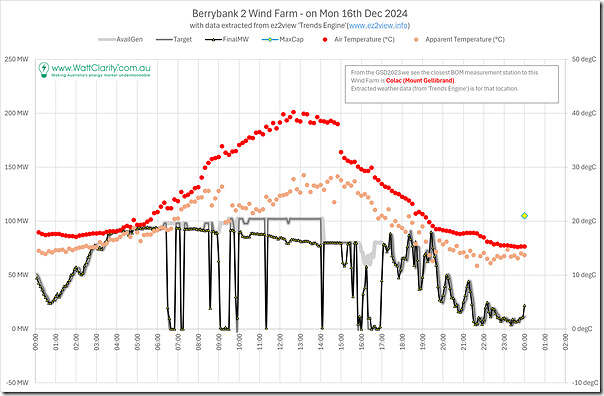
Here’s the trend with temperature (with the readings again from the BOM station at Colac):
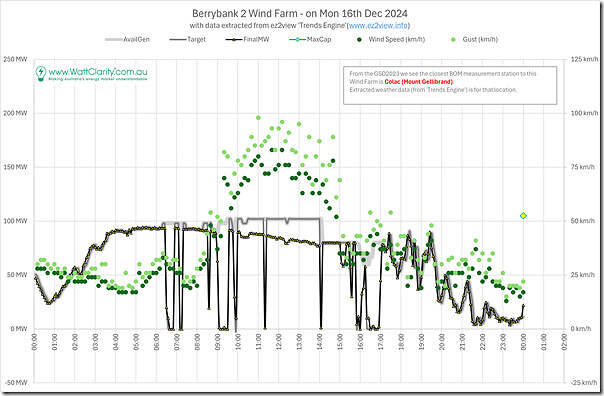
Here is the trend with Wind Speed:
(C2) Second cluster, in the Moyne Shire Local Government Area
The project websites for Ryan Corner Wind Farm and Hawkesdale Wind Farm note that these Wind Farms are in the Moyne Shire. This WattClarity map shows that these two wind farms are further south-west of the two Berrybank Wind Farms.
These two wind farms show some similarities to the Berrybank 1 and Berrybank 2 Wind Farms, though they are not identical.
Hawkesdale Wind Farm … on Monday 16th December 2024
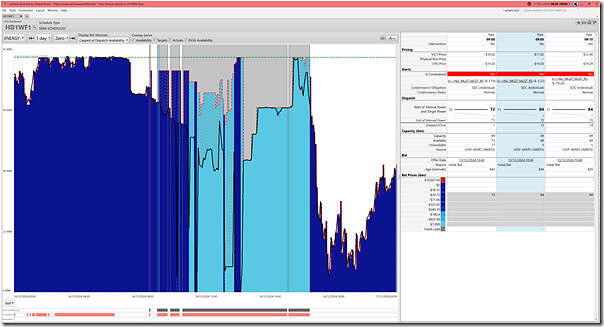
Here are the same 4 x charts for Hawkesdale Wind Farm, starting with the snapshot from the ‘Unit Dashboard’ widget in ez2view focused on HD1WF1 (with the DUID too-easily confused with the pre-existing Hornsdale group of 3):
In this case one clear difference from the two units above was that the output (and Availability) was close to MaxCap until 07:20, when there was a drop in both (from nnn MW to nnn MW). This was the
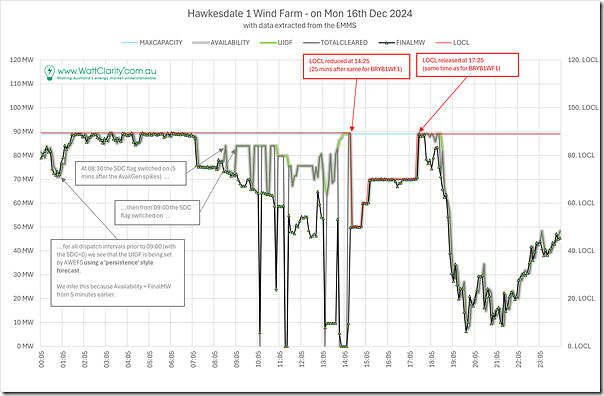
Here’s the trend including Local Limit (LOCL):
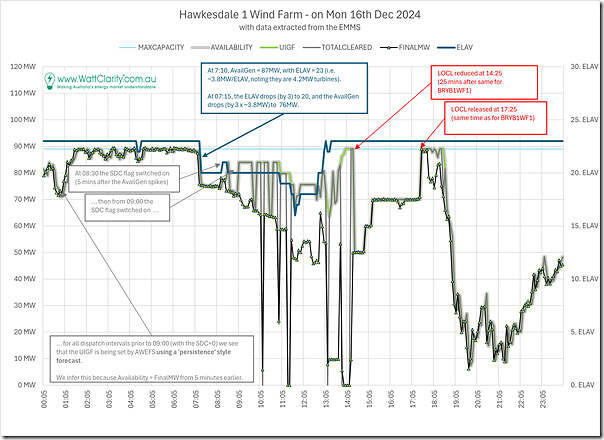
The drop in AvailGen at 07:15 is not explained in this trend of LOCL however. In this case we turn to the other data set the AEMO started publishing at the same point in 2024, called ‘elements available’ (ELAV):
In this case we can see there’s a clear link in the drop in Actual Output (and AvailGen) in the removal from service of 3 of the 24 x turbines which are (according to the project website for Hawkesdale Wind Farm) of 4.2MW size.
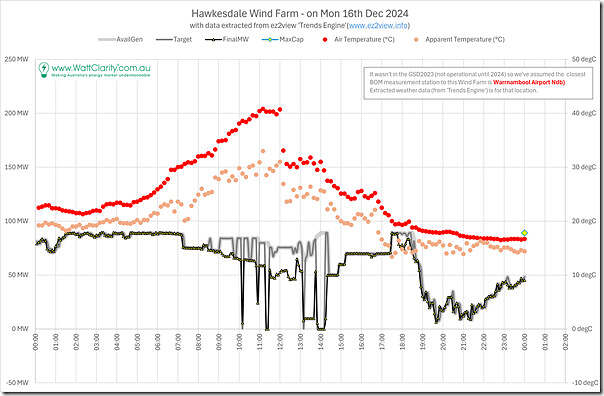
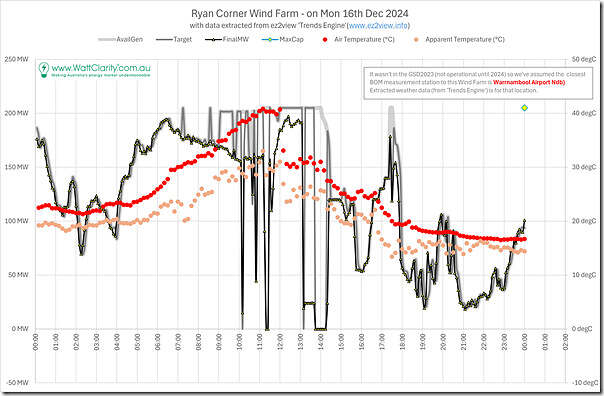
However the subsequent gradual decline in output from that point does not match nearly so well with further reductions in turbines available. So here’s the trend with temperature (in this case utilising BOM readings from Warrnambool airport):
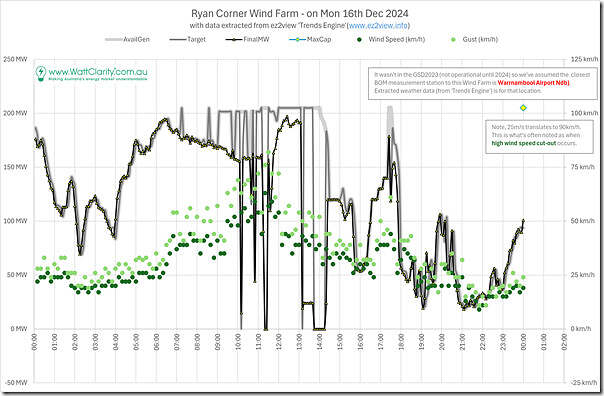
Here is the trend with Wind Speed:
Ryan Corner Wind Farm … on Monday 16th December 2024
The Ryan Corner Wind Farm is (of the four in this subset) the furthest south and west.
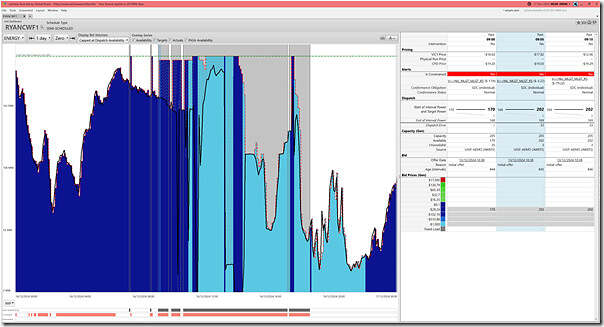
Here are the same 4 x charts for Ryan Corner, starting with the snapshot from the ‘Unit Dashboard’ widget in ez2view focused on RYANCWF:
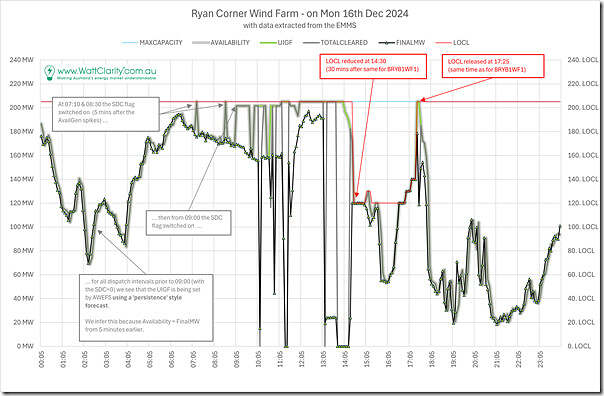
Here’s the trend including LOCL:
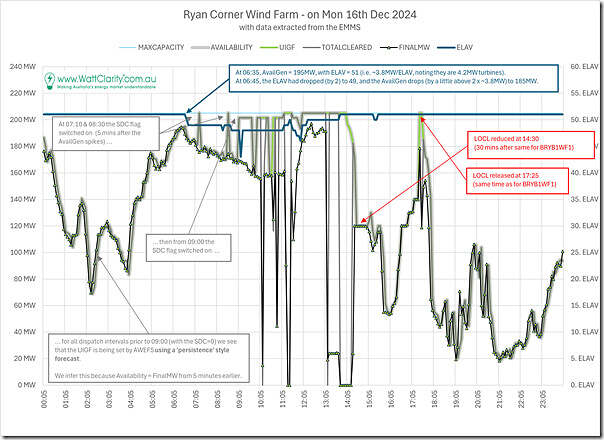
In the case of Ryan Corner Wind Farm, we can also see that there’s changes in ‘elements available’ (ELAV) that also correlate with changes in Availability:
Here’s the trend with temperature:
Here is the trend with Wind Speed:
(D) Summing up
It will be useful for us, and might be useful for other readers, for us to sum up what we’ve gleaned thus far….
(D1) Observations, Insights and Questions
What follows is a brief summary of the above.
Summary #1) For all four wind farms in this group, there was a steady downwards trajectory of output through the day … much more pronounced and longer for the 2 x Berrybank stations than for the other 2.
(a) I don’t think we’re able to really deduce a specific cause for this;
(b) It doesn’t appear that this was related to a drop in wind speed;
(c) On the flip side, it may be that this was related (perhaps in part) to either, or both, high temperatures effect and/or high wind speed cut-out.
i. The jury is out in terms of how useful the readings are from the nearest BOM measurement point
ii. On this note, we’re particularly interested to hear from our more learned readers.
Summary #2) For all 4 wind farms, during SDC periods the AWEFS power curve forecasting model really struggled to produce accurate forecasts
(a) This led to large ‘Raw Off-Target’ measures;
i. though note that, because the Target >> Actual Output on these occasions, there should not no Conformance implications here.
ii. But which may well have provided implications for ‘Causer Pays’ cost calculations for Regulation FCAS.
(b) We’ve started to explore here, and might continue with more later…
Summary #3) Two new data sets that the AEMO started publishing in mid-August 2024 are a welcome boost in providing more transparency:
(a) We see that:
i. It appears that, in response, the LOCL (local limit) was used to bring the AWEFS forecasts back into line with reality for all 4 wind farms.
ii. For two wind farms (Hawkesdale and Ryan Corner Wind Farm) also show clear signs that changes to ELAV (elements available) have an impact on availability.
(b) It’s on our ‘things to do’ list to ascertain how best to incorporate into ez2view.
Summary #4) For all 4 units, some of the yo-yo-ing of output was related to the (could still be improved?) nature of the auto-bidders deployed.
(D2) Chronology
To the extent that time permits, we might (later!) sum up a sequence of events through the day, flagging a number of questions we have…


Leave a comment