Yesterday we published this ‘Further analysis (and more questions) about four VIC Wind Farms on Monday 16th December 2024’.
1) As noted there, that (analysis and) article was part of a learning journey for us,
2) Part of this process was the exploration of both ELAV and LOCL, two relatively new* data sets from the AEMO for Semi-Scheduled units.
* this is a relatively new data set that the AEMO begun publishing in mid-August 2024, as noted in the article ‘AEMO commences publishing actual intermittent generators (SCADA) availability data to the EMMS Data Model’.
A history of Murra Warra 1 Wind Farm
So let’s take a quick look at another case where the new data could be of use ….
The most recent ~5 months (improved transparency)
Keeping in mind that there’s only been 5 months or history published of these two new data series for the Semi-Scheduled units at this point in time (but also that this appears a great set in reducing some invisibility about actual (technical) availability VRE units) we’ve been turning our mind to how we might use this.
One possible longer-term style query (albeit with only 5 months of history at this point) was inspired by the RenewEconomy article by Sophie Vorrath on 6th November 2024 (now 2 months ago) ‘Turbine shut downs at Victoria wind farm part of “staged maintenance,” says Squadron’ in RenewEconomy.
From that article, the key bits were the following (at least in my reading):
‘Squadron Energy has confirmed that a number of turbines at the 226 megawatt (MW) Murra Warra 1 wind farm in north-western Victoria are temporarily out of action, as part of “staged maintenance” to replace failed bearings.
…
Squadron says the works are limited to 32 of the project’s 61 Senvion turbines, with 15 currently switched off to undergo maintenance – half of the number claimed in local media reports on Wednesday.’
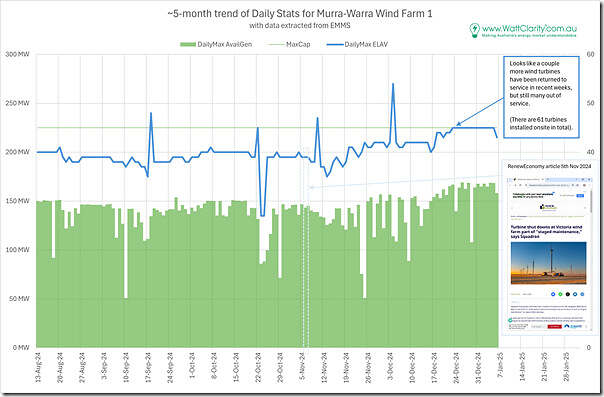
Curious what we’d see in the limited history available at this point, we extracted data and produced the following:
Brief notes, with respect to the data:
1) Have not looked into the 4 spikes (and 1 trough) in the ‘DailyMax ELAV’ data … so can’t comment on what they represent
2) Looking past them, it appears that:
(a) In the days from August to late in November, there were fairly consistently 40 turbines noted as available:
i. Which would mean 21 turbines generally unavailable;
ii. So (given the ‘15 currently switched off’ note in RenewEconomy), an unknown about the additional ~6 turbines unavailable
(b) Since early December it appears that the number available has trended up to be ~45
… so another 5 turbines returned to service.
c) We see this is reflected in an increase in ‘DailyMax AvailGen’.
The most recent 3 years (but with reduced transparency)
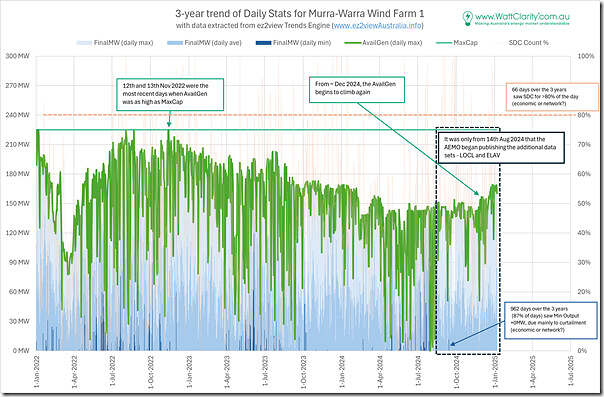
Curiosity drove me further, so I extracted a longer range of unit-level data from the ‘Trends Engine’ in ez2view as follows:
With this trended 3-year history, note that:
1) One needs to look back to November 2022 (i.e. more than 2 years earlier) to find any day seeing ‘DailyMax AvailGen’ up at the Maximum Capacity of the plant (225MW):
(a) Keep in mind that the AvailGen figure is energy-constrained (i.e. reflecting limits imposed not only by the physical plant availability, but also by the wind resource at the time);
(b) But, even so, it appears that the Murra Warra 1 station might have been experiencing bearing issues since as far back as the end of 2022?
(c) Perhaps needless to say, but the missing ‘area under the curve’ would represent a significant lost revenue opportunity for ENERGY + LGCs over that two year period.
2) Out of curiosity, we also see:
(a) Most days see some dispatch intervals with Semi-Dispatch Cap on:
i. Specifically, only 77 days across 3 years with no SDC at all
ii. At the other end, 66 days across 3 years with SDC on for more than 80% of the day.
(b) This might be due to network curtailment and/or economic curtailment
… presumably a share of both across the 3 year period
c) As a result, we see that 962 days across 3 years (a whopping 87% of cases) see DailyMin FinalMW (i.e. minimum daily output) being at 0MW
i. Whilst some of these days might be due to absolutely zero wind;
ii. I’m guessing that most of these 962 days will have been due to curtailment (of one form or the other, or both).
A (very welcome) boost to transparency!
In conclusion, this is another example where the recent* commencement of the ELAV data series for Semi-Scheduled units is a very good thing for enhancing transparency in the NEM.
* this is a relatively new data set that the AEMO begun publishing in mid-August 2024, as noted in the article ‘AEMO commences publishing actual intermittent generators (SCADA) availability data to the EMMS Data Model’.
1) Thanks AEMO!
2) If I had to quibble, it would be better if this were rolled up in the rebidding process, so changes to both ELAV and LOCL could be accompanied by rebid reasons, and all of the AER rebidding processes.


Be the first to comment on "A couple of wind turbines returned to service at Murra Warra 1 Wind Farm in Victoria"